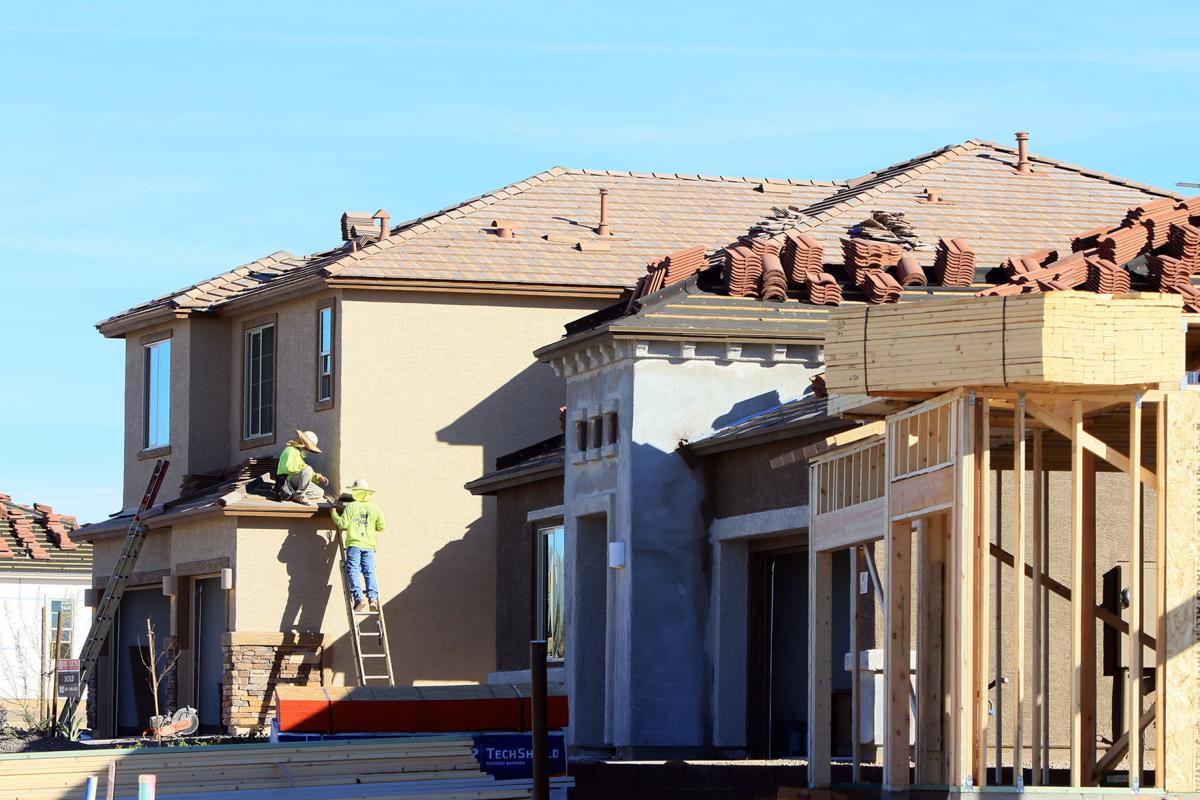
PHOENIX — Arizona continues its most rapid growth on the edges of its largest communities.
New figures released last week from the U.S. Census Bureau show Queen Creek grew a whopping 8.2 percent in the year ending June 30, 2016. Those are the most recent figures available from the federal agency.
Jim Chang, the state demographer, told Capitol Media Services this isn’t some sort of mistake.
“That number is actually very real,” he said, mirroring estimates he makes for the state Office of Economic Opportunity. “It’s actually growing pretty fast.”
Queen Creek, extending from the far southeast side of Maricopa County into Pinal County, has the advantage of being adjacent to a lot of vacant land. That makes it a prime opportunity for growth.
A similar situation exists on the other side of the Phoenix area, with Buckeye showing a 4.8 percent year-over-year growth.
The availability of land to grow also boosted the population of Marana by 3.6 percent in just one year and Apache Junction by 3.3 percent. Tucson, meanwhile, showed small population growth year over year.
For some other communities logging what appears to be rapid growth, there may be less there than meets the eye.
Take Casa Grande, which according to the Census Bureau grew by 3.3 percent.
Chang said there has been construction in the Pinal County community. But he said that a prior population estimate, based on housing construction reports, “left out a few hundred units.”
So the actual year-over-year increase may be less than what the new report shows. Still, the community is growing, with the new population figures 12.2 percent more than the 2010 census.
At the other extreme, the Census Bureau figures that Florence shed 691 residents. That translates out to a 2.6 percent population decline.
Chang said, though, that year-over-year changes in Florence may simply be linked to changes in prison population.
Hayden lost 1.7 percent of its residents, followed by Willcox at 1.5 percent, Tombstone at 1 percent and Huachuca City with a 0.9 percent drop.
The figures for Cochise County communities reflect the anemic economic situation in all of Cochise County. A separate report by the state Office of Economic Opportunity shows no overall job growth in the past 12 months, with the 300 new private-sector jobs being offset by an identical loss in government positions.
Chang said the numbers reflect the continued fallout from decisions made years ago by the military to redeploy some people stationed at Fort Huachuca. He said this has had a continuing ripple effect on not only Sierra Vista, but also on nearby communities.
The annual report is based on estimates done by the federal agency starting with the official decennial base counts of housing units and population.
Census Bureau staffers then update that each year to first reflect boundary changes. They then factor in households to come up with the each year’s mid-decade figures.
All this, of course, is subject to correction when the figures from the 2020 census, involving an actual count, are released in 2021.
But the interim figures provide at least some indication of where the state is growing — or not.
That in turn, has important implications.
For example, cities get revenue sharing from the state based on population. With the amount of revenue-sharing dollars determined each year based on fixed formulas, that means more for the rapidly growing communities and less for those that do not grow as fast as the state average.
And there also can be political fallout.
The state is divided into 30 legislative districts, each supposedly with essentially equal population.
With a fixed number of House and Senate seats, that means more representatives coming to the Capitol from the most-populated areas. And that, in turn, means slow-growing areas — particularly in rural counties — will find themselves with fewer people to make their case in Phoenix.
Congressional representation is a bit trickier.
There are 435 seats in the U.S. House, apportioned by population. Arizona’s growth between 2000 and 2010 gained it a ninth seat.
If the state’s growth is sufficient, Arizona might have another member of Congress after 2020. That then involves redividing the state into 10 — or possibly 11 — equally populated congressional districts
By definition, the Census Bureau numbers are estimates. But the agency is not the only one keeping tabs, with Chang also doing similar counts for the Office of Economic Opportunity.
There are some differences.
Statewide, for example, the Census Bureau puts the June 30, 2016, population at 6,931,071. But Chang figures the actual state population on that date was about 95,000 less.
That’s a difference of only about 1.4 percent.
But the ability to do accurate estimates for both the feds and the state get trickier as you move from statewide numbers to county figures and, ultimately, to cities and smaller towns.


