After earning a graduate degree in atmospheric science from the University of Wyoming and then spending 12 years with the National Weather Service, Ken Pomeroy moved full time into college basketball analytics eight years ago.
He had already started interpreting college basketball quantitatively through his Kenpom.com site since 2004, and the use of analytics was exploding in all sports. Plus Pomeroy said he liked controlling his schedule, which wasn’t easy in the weather business.
“But the science of meteorology, making forecasts and dealing with storms and things like that — that was really, really fun,” Pomeroy said. “I do miss that part of it.”
So instead, Pomeroy now forecasts college basketball teams … and his forecast for Arizona, with a half-season of evidence, is mostly sunny. Pomeroy ranks Arizona No. 13 overall, picks the Wildcats to win the Pac-12 and says they could win a few games in the NCAA Tournament.
Why? Let’s take a deep dive into Kenpom.com, with Pomeroy himself as a guide:
(Arizona’s Kenpom ratings and percentages listed are as of Wednesday, with corresponding national rank out of 353 Division I teams in parentheses)
Overall strength

In the measurement of coaches who decide to keep in starters who pick up two fouls before halftime, Sean Miller falls in the middle of the pack.
Offensive efficiency: 114.4 (8th)
Defensive efficiency: 92.9 (42nd)
The first place Pomeroy — or just about any college basketball coach — will look on his chart is this pace-independent measure of how good a team really is. He said he thought of the idea on his own and then realized it had already been explained by Dean Oliver in his 2004 book, “Basketball on Paper.”
Offensive efficiency is simply the amount of points a team scores per 100 possessions, and defensive efficiency is the amount of points their opponents score per 100 possessions.
“It’s an idea a lot of people have had,” Pomeroy said. “It kind of makes sense to measure offenses and defenses that way.”
Pomeroy says offensive efficiency is a slightly more important predictor of a team’s potential than defensive efficiency, so the Wildcats need not fret too much considering their top-50 defense is paired with a top-10 offense.
Style

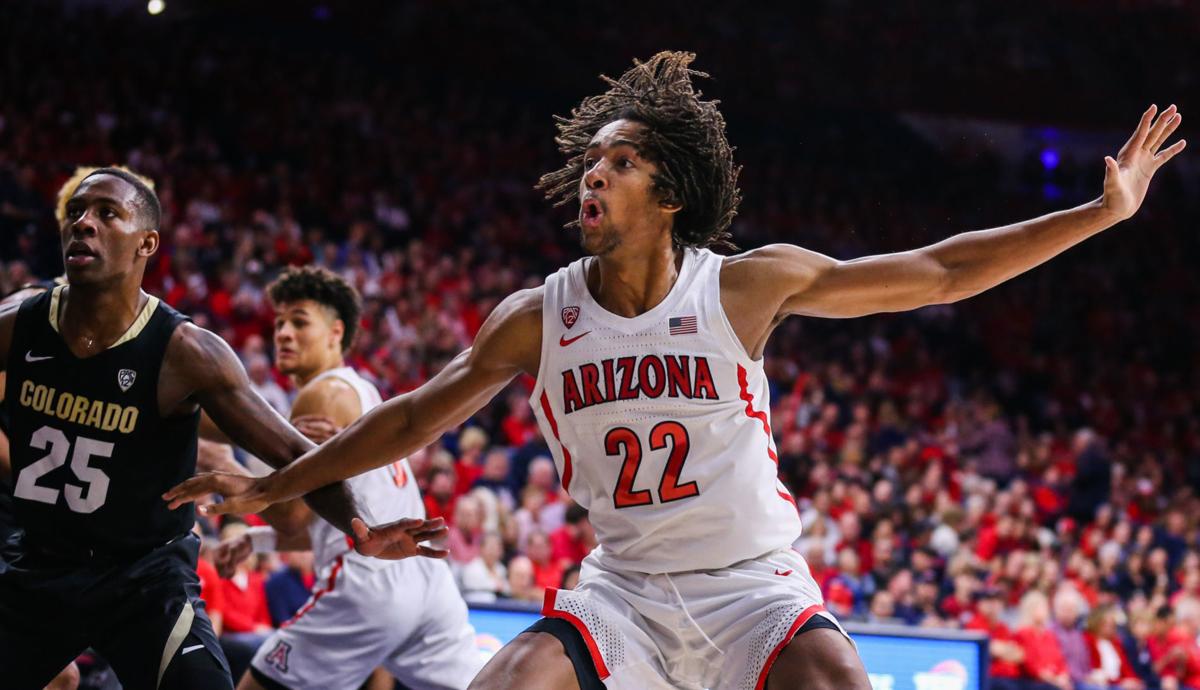
Arizona Wildcats guard Nico Mannion (1) passes the ball around Colorado Buffaloes guard McKinley Wright IV (25) during a game at the McKale Center, on Jan. 18. 2020.
Adjusted tempo: 69.1 (145th)
Assists/Field goals made: 58.0 (44th)
At first glance, the rather average tempo number might suggest coach Sean Miller is exaggerating when he says “I’m not trying to hold our guys back at all, trust me,” as the UA coach did last week.
But adjusted tempo is actually a factor of both offensive time of possession and defensive time of possession — and the Wildcats hold the ball for an average of only 16.1 seconds on their possession, ranking 49th nationally and indicating that, yes, the Wildcats do actually get to run a little.
It’s on defense that the UA slows things down: The Wildcats’ opponents take an average of 18 seconds per possession, the 52nd most in the country.
But while the tempo may matter to fans, it is more of a style characteristic than a predictor of success.
“There’s no judgment there in terms of what is good or bad,” Pomeroy said. “You can have some fast-paced offenses that are good and slow-paced offenses that are good. It’s just a team’s style of play.”
The Wildcats also rank in the top 50 of assisted field goals, another stat that is also more of a style characteristic in Pomeroy’s view.
“There’s a slight trend for that to be a positive statistic offensively,” Pomeroy says. “But Kentucky’s typically one of those teams that scores a lot off the dribble and still has an effective offense, so you can be effective without a high assist percentage as well.”
Shooting

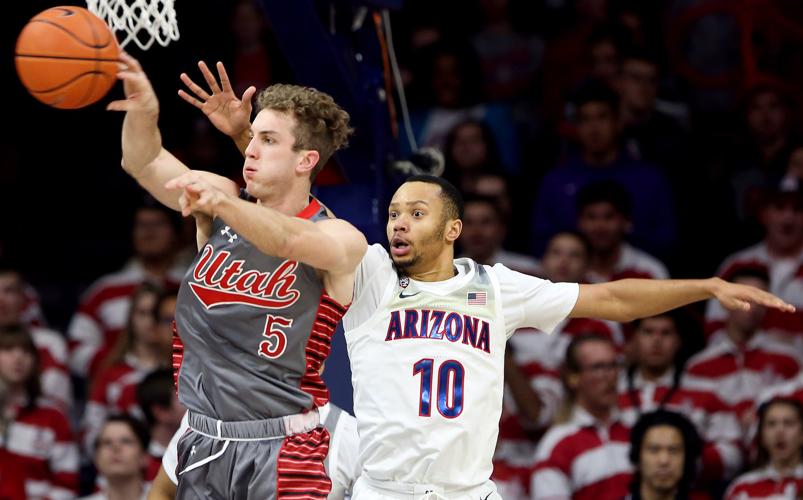
Arizona Wildcats guard Max Hazzard (5) warms up before Arizona vs Long Beach State men’s basketball game in the Wooden Legacy Tournament in McKale Center on November 24th, 2019.
Effective field goal percentage: 54.6 (13th)
3 pointers attempted / field goals attempted: 33.4 (272nd)
Free-throw rate (FTs attempted / FGs attempted): 36.3 (79th)
Effective field goal shooting percentage is simply field goal percentage with an extra 50 percent credit given to 3-pointers.
In Arizona’s case, it incorporates the fact that the Wildcats shoot 38.2% from 3-point range (17th nationally) and 53.3% from two-point range but take only 33.4% of its shots from 3-point range, a style characteristic that suggests the Wildcats are careful about long-range shots.
Meanwhile, Arizona’s free-throw rate (ratio of free throws attempted to field goals attempted) suggests the Wildcats are also pretty good at getting to the line.
Overall, Arizona gets 51.1% of its points from two-pointers (ranking 126th nationally), 28.2% from 3s (241st) and 19.7% from the free throw line (130th).
“When you see a team that is shooting 3s very well, but they don’t take many, usually that’s the hallmark of a team that doesn’t have a lot of good shooters,” Pomeroy said. “There might be three good shooters and everybody else is ordinary. So the average fan might look at that and say they should shoot more, but the guys who would be shooting them are bad shooters.”
Of players who have made at least one 3-pointer per game, the Wildcats have only three who are shooting over 33 percent: Jemarl Baker (42.9), Dylan Smith (42.5) and Max Hazzard (39.1).
For individual players, Pomeroy also lists “true shooting” percentage as conceptualized by another college basketball analyst, John Gasaway. That metric adds free-throw shooting to the effective field goal percentage.
It might be of little surprise to the Wildcats that forward Zeke Nnaji rates fourth nationally with a “true shooting percentage” of 70.1. Nnaji shoots 67.1% from 2, 33.3% from 3 and 79.8% from the line.
“If you’re making 80% of your free throws, that’s like you’re making 80% of your field goals” per two field goals, Pomeroy said. “So (Gasaway) gave that part of it a lot of credit, as he should, because it reflects on the scoreboard as well.”
Ball control

Arizona Wildcats guard Nico Mannion (1) runs the ball up the court during a game against the Colorado Buffaloes at the McKale Center, on Jan. 18. 2020.
Turnover percentage: 16.3 (27th)
Block percentage: 7.0 (32nd)
Steal percentage: 6.4 (7th)
Non-steal turnover percentage: 9.9 (159th)
Miller says he likes his teams to aim for single-digit turnovers per game, and they’re not too far off the mark at 11.7. But turnover percentage is a pace-independent measure of ball security — simply the percentage of times a team turns the ball over during its possessions — and the Wildcats are also doing pretty well there at 16.3.
The UA also doesn’t often lose balls via opponent blocks (7% of the time) or steals (6.4%), but the Wildcats curiously have a relatively high number of non-steal turnovers — the times they lose the ball via offensive charges, travel calls or passes that fly out of bounds.
“That is an interesting number (for Arizona), and it’s kind of all of the above,” Pomeroy said. It’s “carelessness, if you want to call it that, but it tends to be more the responsibility of the offense.”
Rebounding

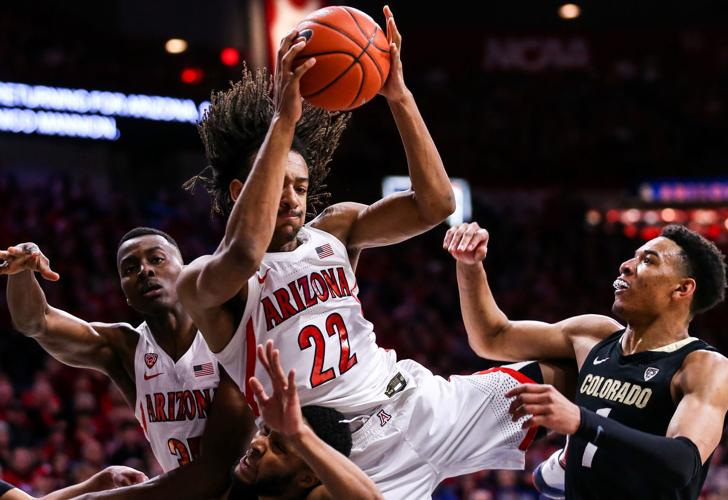
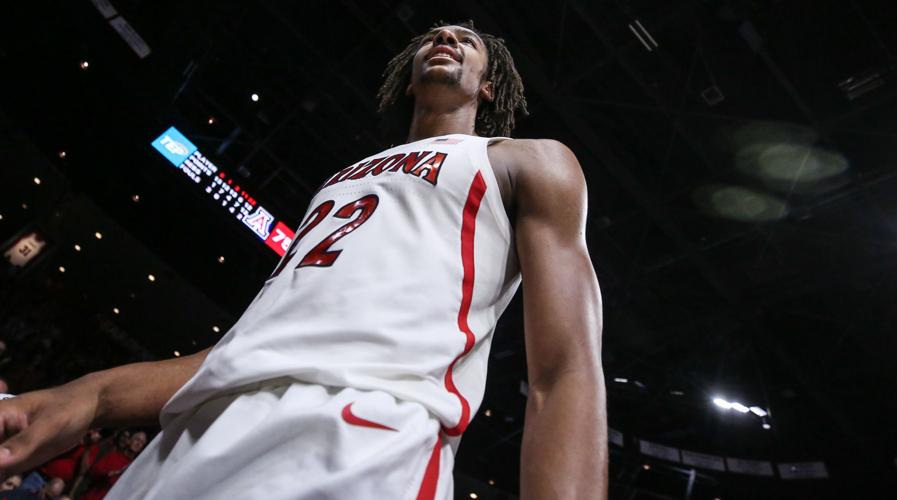
Arizona Wildcats forward Zeke Nnaji (22) falls into a group of players after grabbing a rebound during a game at the McKale Center, on Jan. 18. 2020.
Offensive rebounding percentage: 30.8 (91st)
Defensive rebounding percentage: 27.2 (131st)
Raw rebounding numbers can sometimes tell enough of the story — like how Arizona clobbered Colorado on the glass last Saturday, out-rebounding the Buffaloes 39-25 in their 75-54 win Saturday at McKale Center.
But context is always missing. Like when Arizona collected 10 offensive rebounds at Baylor on Dec. 7 — an impressive number until you consider that the Wildcats shot only 26.9% that day and missed 38 shots, an offensive rebounding percentage of only 26.3. The Division I average is 28.3%.
Conversely, Oregon State had only seven offensive rebounds in its 82-65 win over the UA on Jan. 12, but missed only 23 shots, so the Beavers actually had a respectable offensive rebounding percentage of 30.4.
That’s why when Arizona was out-rebounded 31-28 overall at OSU, it felt like a much bigger margin to Miller.
“It is deceiving,” Miller said after that game. “You’ve gotta go through the percentages.”
The percentage look at the Wildcats’ rebounding explains why Miller has repeatedly called rebounding their “Achilles’ heel.” The UA is decidedly mediocre on both ends of the court — and especially on the defensive side, which can lead to easy second-chance buckets by opponents.
One reason Pepperdine scared Arizona in a Nov. 28 Wooden Legacy game was not just that the Waves shot 50.8% from the field — but also that they had nine offensive rebounds on 29 misses (a respectable 30% offensive rebounding percentage) and scored 14 second-chance points off them.
Arizona won that game just 93-91.
Defense

Third-year guard Jemarl Baker, right, doesn’t do much to lift Arizona’s “experience” ranking because of his injury history at Kentucky.
Opponents’ effective field goal percentage: 44.3 (24th)
Opponents’ 3-point percentage: 31.7 (114th)
Opponents’ 2-point percentage: 42.3 (13th)
Opponents’ turnover percentage: 20.5 (100th)
Opponents’ free-throw rate: 36.9 (270th)
While Miller doesn’t have one of his vintage defensive teams this season, he can take heart in one stat in particular: The fact that the Wildcats hold their opponents to just 42.3% from 2-point range, though that figure has been 47.3% so far in Pac-12 play.
“Your 2-point percentage defense is almost like part of your defensive DNA,” Pomeroy says. “If you’re not good at that, you just can’t fix that. That’s personnel-based.
“So that’s pretty encouraging. Unfortunately, they aren’t really good at anything else defensively so that kind of drags them down.”
The Wildcats are only slightly above average in 3-point shooting defense and their heavy fouling (18.7 per game) results in opponents getting to the line often. (The UA’s relatively low ability to generate turnovers may be partly attributed to the fact that Miller’s pack-line defense does not emphasize gambling for steals as much as clogging the lanes and preventing dribble penetration).
“They commit too many fouls, they don’t force a lot of turnovers, they’re not a great rebounding team, so that kind of hurts them,” Pomeroy says. “But I think if they can get that 2-point percentage back and be the best in the conference, then the defense has a chance to be good enough to win them some games.”
Personnel

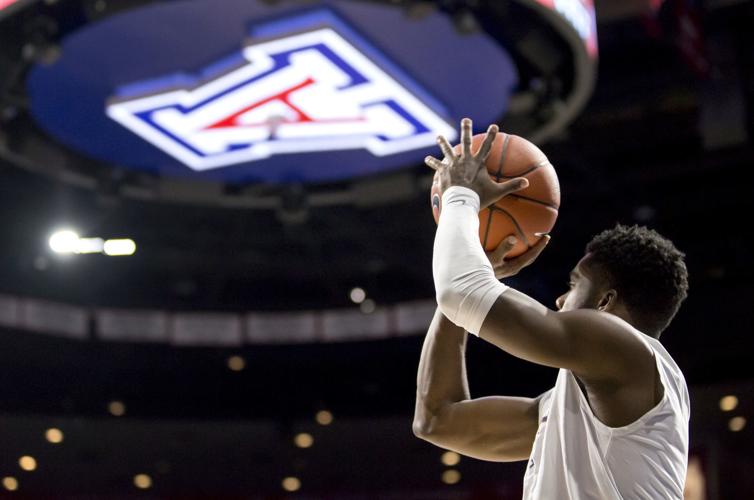
Arizona Wildcats guard Josh Green (0) takes a shot towards the basket in the first period of a game against the Colorado Buffaloes at the McKale Center, on Jan. 18. 2020.
Bench minutes: 32.1% (149th)
Experience: 1.28 years (298th)
Minutes continuity: 29.3% (305th)
Average height: 6-foot-6.3 (18th)
2-foul participation: 21.2 (168th)
For UA fans who follow recruiting and Miller’s tendencies over his 10-plus seasons in Tucson, none of these numbers are likely to be a surprise.
Thanks to considerable roster turnover that resulted in Miller needing grad transfers and freshmen alike to make up his current roster, the Wildcats are not quite as much young as they are new, as measured in “minutes continuity” — a formula Pomeroy introduced in 2016 that measures how much of a team’s minutes are played by the same player from last season to this season.
Guard Dylan Smith, forward Ira Lee and (until he missed the past two games) center Chase Jeter are the only returning UA players contributing significant minutes — and only Smith (24.5) is playing the same amount of minutes, while Lee and Jeter are both playing more than four minutes fewer this season.
Although the Wildcats have four fifth-year players, they also have a low experience ranking, since Pomeroy factors in minutes played into both his experience and height calculations.
Doing so means third-year guard Jemarl Baker brings little “experience” because of his injury history at Kentucky, while 7-footer Christian Koloko doesn’t significantly add to UA’s height because he averages just 7.4 minutes and didn’t play at all in four games.
Miller goes deeper on his bench this season, usually up to nine players, but gives an average number of bench minutes out. He’s also in the middle of the pack when deciding to keep in starters who pick up two fouls in the first half.
Pomeroy says other coaches such as Michigan State’s Tom Izzo (3.7% in two-foul participation) and Virginia’s Tony Bennett (5.6%) have much stronger aversions to keeping anybody in the game when they pick up two fouls before halftime.
Individual leaders

Arizona Wildcats forward Zeke Nnaji (22) walks around the side of the court before the end of a game against the Colorado Buffaloes at the McKale Center, on Jan. 18. 2020.
Offensive rating: Zeke Nnaji 122.9 (55th nationally)
Possessions used: Nico Mannion 25.4 (311st)
Effective field goal percentage: Nnaji 66.2 (15th)
Offensive rebounding percentage: Nnaji 13.0 (61st)
Defensive rebounding percentage: Nnaji 20.1 (238th)
Assist rate: Mannion 35.1 (37th)
Turnover rate: Jemarl Baker 10.7 (114th)
Fouls committed per 40 minutes: Mannion 2.2 (353rd)
Fouls drawn per 40 minutes: Nnaji 5.8 (99th)
Free-throw rate: Nnaji 59.3 (59th)
Pomeroy and other analytics sites also throw in advanced individual stats that go well beyond the usual box score lines, most measuring production only within the minutes they are on the floor.
As seen anecdotally in most Wildcats games this season, Nnaji excels not only in shooting efficiency but also in rebounding and drawing fouls, and guard Mannion rates among the best nationally in assist rate by recording the assist on his teammates’ made field goals 35.1 percent of the time when he’s on the floor.
When viewing individuals, Pomeroy says he looks first both at overall percentage of possessions that players are used — when their actions end a possession, via a shot or turnover — and their overall offensive rating, a complicated measure of individual efficiency as developed by Oliver.
Those two metrics should be viewed “kind of combined,” Pomeroy said, “Because obviously you can play a big role and be inefficient or you can play a small role and be efficient.”
Arizona has three players who clearly lead the way in both of those areas — Nnaji, Mannion and freshman guard Josh Green — and Pomeroy says that’s a good sign for the Wildcats. They’re all efficient and play big roles.
So if Arizona’s season plays out with the kind of success Pomeroy predicts, chances are those three guys will lead the way.


