


We know Arizona’s offense is vastly improved in Year 2 under Jedd Fisch.
Is the defense better under Johnny Nansen than predecessor Don Brown?
It’s a much more complicated question and one without a clear answer. But with five games in the books, we have enough data to at least take a stab at it in this week’s edition of “Cats Stats.”
Now, a five-game sample isn’t a 12-game sample, and the Wildcats have yet to face the meat of their schedule. That killer stretch starts Saturday against No. 12 Oregon.
Although isn’t a pure apples-to-apples comparison, it’s the best we’ve got at this point. It’s also important to note that, unlike the offense, the bulk of Arizona’s defensive production is coming from the same players as last year.
To try to answer our original question, we’ve broken down Arizona’s defensive profile into five categories. Let’s get to it.

Total defense
This is a commonly used term for total yards allowed. It doesn’t always paint a complete picture, though. For our purposes, we’re going to look at three stats here.
Yards per game
2022: 400.8
2021: 372.4
The 2021 squad has a pretty sizable edge here. This year’s numbers are skewed by the Cal game, in which the Golden Bears compiled 599 yards. Maybe yards per play tells a different story? Let’s have a look.
Yards per play
2022: 6.4
2021: 5.9
Nope. Same deal. The advantage still goes to the ’21 Wildcats. If you take out the Cal game, this year’s defense would be allowing 5.6 yards per play. But you can’t do that. Time will tell whether that performance was an outlier.
Points per game
2022: 31.2
2021: 31.4
Looks like a push, right? Well, let’s dig a little deeper. Last year’s team allowed six non-traditional touchdowns (interception returns, blocked-punt returns, etc.). This year’s team has yielded one. Assuming seven points for each score, last year’s defense actually allowed 27.9 points per game. This year’s is yielding 29.8. Advantage, 2021 unit.
Category winner: Brown
Rushing defense
Again, we need to dig a little beneath the surface here to get a truly accurate portrait. We can do that by taking sacks out of the equation. Here are both sets of numbers:
Yards per game
2022: 213.4
2021: 182.3
Sack-adjusted yards per game
2022: 223.8
2021: 193.9
The difference is roughly the same. Any way you look at it, the advantage lies with the 2021 defense. Again, the Cal game throws this one out of whack. You could include the North Dakota State game as well. Arizona yielded 318.5 rushing yards per game in those two contests. In the other three games, that figure is 143.3. But they all count.
Average per rush
2022: 5.9
2021: 4.6
Sack-adjusted average per rush
2022: 6.5
2021: 5.1
Again, no major change after extracting sacks; a decisive edge for the 2021 defense; and the ’22 numbers are heavily influenced by the NDSU and Cal games. Arizona’s yards allowed per rush vs. the Bison and Golden Bears: 7.7. Against everyone else: 4.4.
Category winner: Brown
Passing defense
This one could go either way depending on what you value most. Let’s take a quick peek at five applicable stats.
Yards per game
2022: 187.4
2021: 190.1
No negligible difference here. The ’22 defense has faced both extremes when it comes to pass-run tendencies. The ’21 squad benefited greatly from opponents playing with the lead and not needing to pass. The next category is more revealing.
Yards per pass attempt
2022: 6.9
2021: 8.1
Huge advantage for the ’22 Wildcats so far. It’s largely a reflection of the styles of the two defensive coordinators. Brown was ultra-aggressive and played a ton of man-to-man coverage. Nansen uses more zone and advocates minimizing big plays, as the next stat illustrates.
Passing plays of 20-plus yards
2022: 10 (projected total: 24)
2021: 33
The ’22 defense is on pace to allow nine fewer “explosive” pass plays. That’s a big deal and a tangible sign of improved secondary play, especially at free safety, where Jaxen Turner, Isaiah Taylor and DJ Warnell Jr. all have performed well.
Completion percentage
2022: 65.9
2021: 58.0
This one swings in favor of the ’21 defense. In part, it’s a reflection of style/scheme. Under Nansen, the Wildcats are more willing to allow short completions. Ideally, defenders make tackles to keep those gains to a minimum.
TD passes allowed
2022: 10 (projected total: 24)
2021: 25
This one projects to a wash. Nothing to see here.
Category winner: Nansen

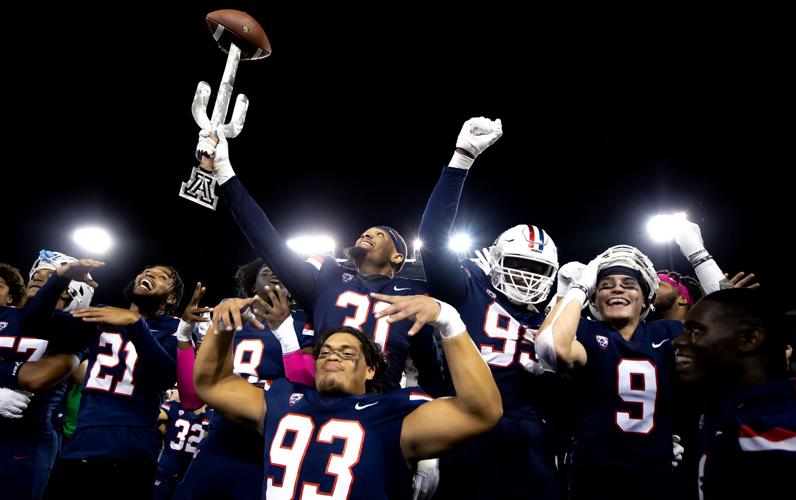
Arizona defensive lineman Hunter Echols (31) holds up the Wildcats’ “turnvoer sword” after causing a Colorado fumble in last week’s win.
Pass rush
We’re going to look at two stats here. Spoiler alert: Neither is particularly conclusive.
Sacks
2022: 9 (projected total: 22)
2021: 22
If you want to get really technical about this one, the ’22 defense is projected for 21.6 sacks. Which isn’t a thing. So 22 it is – same as last year. Where would this year’s pass rush be without newcomer Hunter Echols, who has a team-high 3.5 sacks?
QB pressures
2022: 63 (projected total: 151)
2021: 145
This year’s defense is slightly ahead of last year’s, according to Pro Football Focus’ numbers. PFF credited Arizona with 25 pressures against Colorado – a season high and the most we can recall for a UA defense since PFF started charting that stat.
Category winner: Draw
Miscellaneous — but important
None of these stats fits into the first four categories. But they’re arguably the most meaningful of the bunch.
Third-down percentage
2022: 37.3%
2021: 37.7%
Basically the same as last year. But worth noting: The Wildcats have limited every opponent to less than 50%. That’s a positive development.
Red-zone TD percentage
2022: 71.4%
2021: 76.3%
Slight improvement here in an area that Jedd Fisch emphasized throughout the offseason. But it hasn’t been great since San Diego State went 1 of 4 in the opener. Since then: 14 of 17 (82.4%).
Plays of 20-plus yards
2022: 17 (projected total: 41)
2021: 50
Similar to the 20-plus-yard pass-play stat, the UA defense is trending in the right direction here. The Wildcats’ biggest missteps came against Cal and Jadyn Ott, who had a pair of 70-plus-yard touchdown runs. That’s been the exception thus far.
Takeaways
2022: 7 (projected total: 17)
2021: 6
We saved the most significant change for last. The ’22 defense already has surpassed the ’21 unit in turnovers forced. That was priority No. 1 when Fisch hired Nansen, and his group has delivered big time.
Category winner: Nansen
So the final tally is two for Brown, two for Nansen and one draw — assuming that all categories are weighted equally. If you give more credence to takeaways and explosive plays, Nansen would have the advantage. The next six games will tell us a lot more.

