Arizona allowed 28 points in its monumental upset of UCLA last week. In every other Pac-12 game besides Colorado, the Wildcats had surrendered between 45 and 49 points. Even Cal — which just fired its offensive coordinator and offensive line coach — scored 49. The Golden Bears have scored more than 24 points in only one other conference game.
The Bruins, meanwhile, were averaging 40.8 points. Their season low was 30. It came in their lone loss, at then-No. 10 Oregon. They had scored 40 or more points six times, including a season-high 50 the previous week against Arizona State.
So what changed for the UA defense? Why was the UCLA game different from most of the ones that preceded it?
In this pre-Washington State version of “Cats Stats,” we’ll look at 10 factors that helped Arizona produce one of its better defensive performances of the season.

Sacks
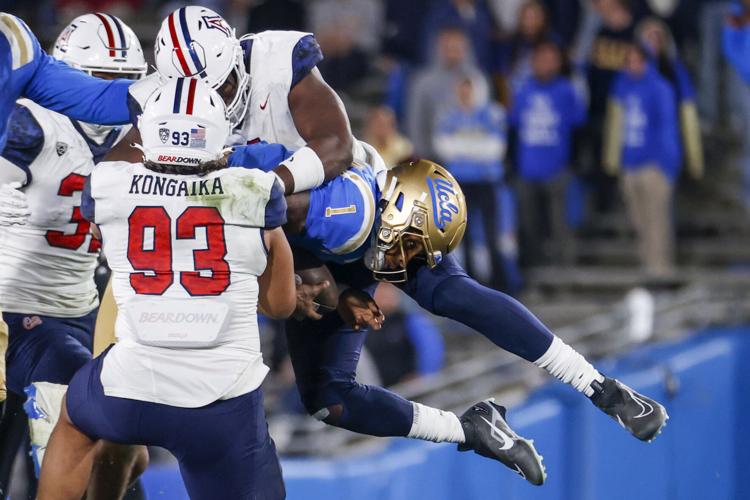
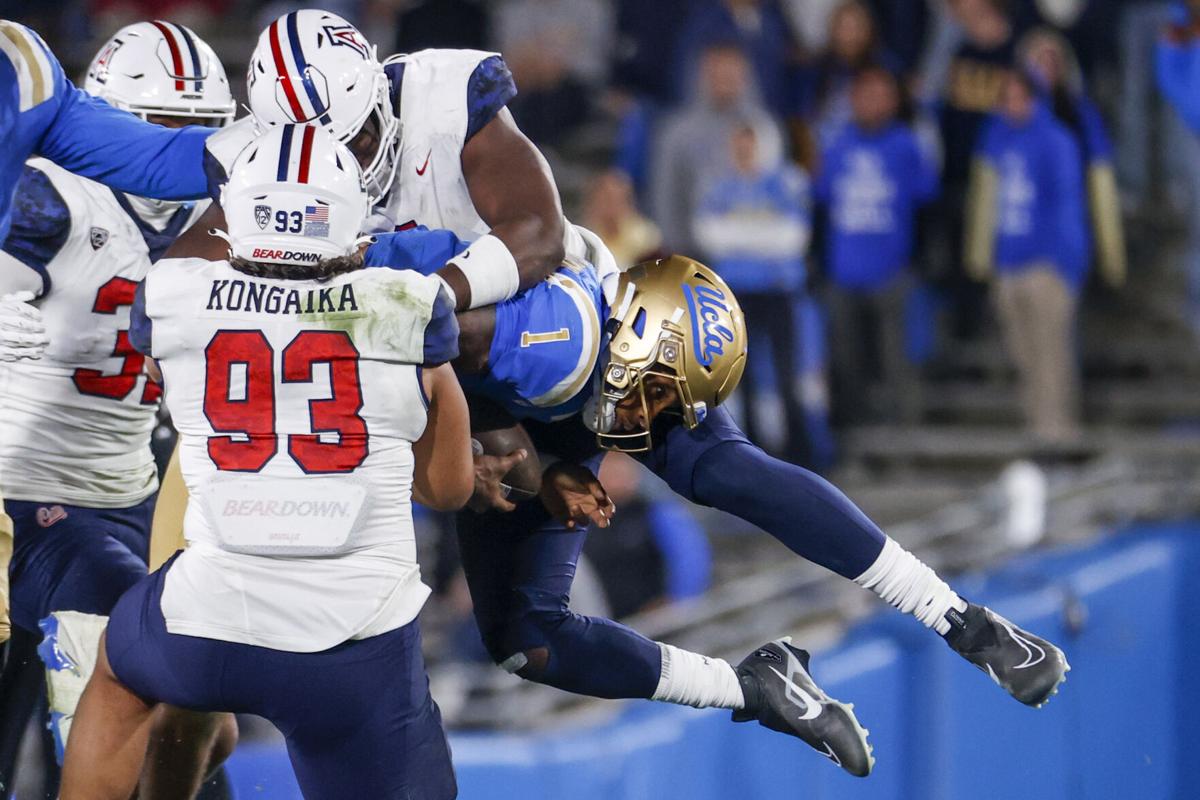
The Wildcats had three of them. That’s a huge number for a team that had struggled to get to the quarterback.
In its five Pac-12 losses, Arizona had one sack. Not one sack in each game. One total sack.
The Wildcats had three in their win over Colorado. They had two in each of their three non-conference games.
Arizona’s season total of 13 is tied for 10th in the Pac-12. But the Wildcats have four in their past two games. They appear to be trending up.
QB pressures
You don’t have to tackle the quarterback to “win” on a pass rush. Arizona coaches and players often talk about “affecting” the quarterback. The Wildcats affected Dorian Thompson-Robinson aplenty.
Arizona registered 25 QB pressures vs. UCLA, according to Pro Football Focus. That matched the Wildcats’ season high — against Colorado, of course.
Arizona hasn’t had more than 13 pressures in any other game. The Wildcats’ average in their other eight contests: 9.5.
It’s important to note that not all games are created equal. UCLA dropped back 48 times. North Dakota State, in Week 3, dropped back only 17 times.
So an even better way to look at this is QB pressure rate (pressures/dropbacks). Arizona had a pressure rate of 52.1% vs. UCLA and 67.6% vs. Colorado. In the other eight games: 28.5%.
Tackles for loss
Arizona had seven vs. UCLA, a season high. (Keep in mind: TFL totals include sacks.) Their previous high was six, achieved twice, vs. Mississippi State and Washington. (The latter is surprising given that the Wildcats barely touched Michael Penix Jr., but it’s true!)
Just as significant, Arizona’s seven TFLs produced 24 yards in losses – also a season best. But the Wildcats are still running a sizable deficit in this area.
Arizona’s 38 TFLs have produced 124 yards in losses. The Wildcats’ opponents have 43 TFLs — for 261 yards in losses.
Put another way: The average TFL by the UA defense produces a 3.3-yard loss. The average TFL by a UA foe produces a 6.1-yard loss.
What accounts for the disparity? The difference in non-sack TFLs, on average, is just 1 yard. The difference in average sack loss is almost 4 yards. Jayden de Laura is amazing at avoiding sacks, but his never-give-up approach leads to some big losses as well.

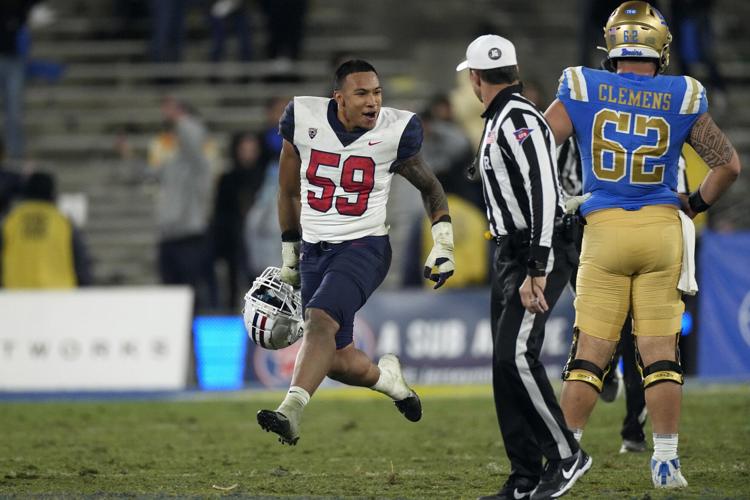
Arizona linebacker Jacob Manu celebrates in the moments following the Wildcats’ upset of No. 12 UCLA on Nov. 12, 2022, in Pasadena, California
Expanded rotation
This wasn’t unique to the UCLA game. But it’s a recent development — and a significant one.
After Arizona’s bye in Week 8, defensive coordinator Johnny Nansen finally fulfilled his promise of playing a robust rotation. In the three games since the bye (UCLA, Utah, USC), at least 19 Wildcats have played 10 or more defensive snaps. The average with 10-plus in those three games: 20.
In the preceding seven games, that number was a shade under 16. Nineteen was the peak.
It’s no coincidence that Arizona was able to generate pressure on two critical fourth-down stops in the fourth quarter.
“At the beginning of the year I mentioned (that) I like to play more guys and keep guys fresh,” Nansen said. “It’s starting to show up in the last couple of games. So we’ve just got to continue to do that.”
Blitzing DBs
Nansen said he didn’t make any schematic changes vs. UCLA. But something threw off Thompson-Robinson aside from the pressure.
One thing we noticed is that Arizona blitzed more defensive backs. The Wildcats had 11 DB pass rushes vs. the Bruins, per PFF, including seven by safety Christian Young. Young had 11 in the first nine games.
Arizona never had more than seven DB pass rushes in those nine games, according to PFF’s data. The Wildcats averaged 4.1.
Missed tackles
This is another stat PFF tracks. Arizona had only 10 missed tackles vs. UCLA, matching its second-lowest total of the season. (The Bruins had a season-high 21.)
The Wildcats also had their second-lowest missed-tackle rate at 13.2% (missed tackles/total tackle attempts). The only game in which they were better was North Dakota State (11%). That game probably was the most similar to UCLA in terms of ebbs, flows and finish.
Arizona has been a better tackling team this season than you might have guessed. The Wildcats have had a missed-tackle rate of greater than 20% only two times this season – against Cal (25.9) and Colorado (20.7).
Arizona had 22 missed tackles vs. the Golden Bears. It hasn’t had more than 14 in any other game.
Third downs
Arizona limited UCLA to a 33.3% conversion rate on third downs. That was the second-lowest figure for a UA opponent this season behind only San Diego State (18.2%).
Entering Saturday, UA opponents had converted almost half of their third downs (49%). In the previous four games (Oregon, Washington, USC, Utah), opponents had a 61.7% conversion rate.
Unsurprisingly, better defensive play on first and second downs led to more third-down stops. UCLA needed an average of 6.5 yards on its third-down attempts. The previous four opponents ranged from 4.6 yards to 5.3.
Fourth downs
The Bruins’ lack of success on third down led to an inordinate number of fourth-down attempts. Chip Kelly went for it five times. No previous UA opponent had more than two fourth-down tries.
UCLA succeeded on only two of them. The three stops were critical.
The first came at the end of the first half, when Thompson-Robinson ran past the line to gain but fumbled. The last two came on UCLA’s final two possessions.
Before Saturday, UA opponents had converted 58.3% of their fourth-down attempts.
Meanwhile, Arizona’s offense — which had a 41.2% success rate on fourth downs in the first nine games — converted both of its opportunities. Which leads us to our next item.
Time of possession
Arizona won time of possession for only the third time this season. The other two occasions were games that they controlled and won easily – San Diego State and Colorado.
Many analysts believe this statistic doesn’t matter — that what does is how many plays each team runs. UCLA ran 76 plays to Arizona’s 65.
We’re not members of that camp. We believe there’s great value in possessing the ball. The Wildcats had it 8 minutes and 40 seconds longer than the Bruins. Put another way, UCLA’s defense was on the field 8:40 longer than Arizona’s.
Field position
The Wildcats had a 9-yard advantage in average starting field position, their best figure of the season and a massive turnaround from the previous week. Arizona was a miserable minus-22 vs. Utah – its worst field-position disparity of 2022.
The UA has won the field-position battle only three times this season (UCLA, Oregon, Colorado). The Wildcats are 2-1 in those games.
They did it vs. the Bruins despite some questionable decisions on kickoff returns and the weather dampening Tyler Loop’s kickoffs. Punter Kyle Ostendorp was masterful (three punts, three inside the 20).
As defensive end Hunter Echols said after the Utah game: “The chance of scoring a touchdown when you’re defending half the field is pretty high.” The longer the opposing team has to go, the lower that chance becomes.
After upsetting No. 12 UCLA at the Rose Bowl, the Arizona Wildcats look to win back-to-back games for the first time since 2019, when they face Washington State on Saturday. Quarterback Jayden de Laura, who played two seasons for the Cougars before transferring, and safety Christian Young spoke to media on Tuesday.


