


The Arizona Wildcats are changing quarterbacks. Again.
This has become something of an annual tradition, no matter the identity of the coach or the length of the season.
The last time one quarterback started every game for Arizona was 2014. Anu Solomon started all 14 contests that year and the first four the following season. Then he got hurt, and QB1 has been a volatile spot ever since.
The Khalil Tate era represented some degree of stability, but even that had disintegrated by the midpoint of his senior year. The Wildcats couldn’t even get through five games last season without having to make a QB change because of injury.
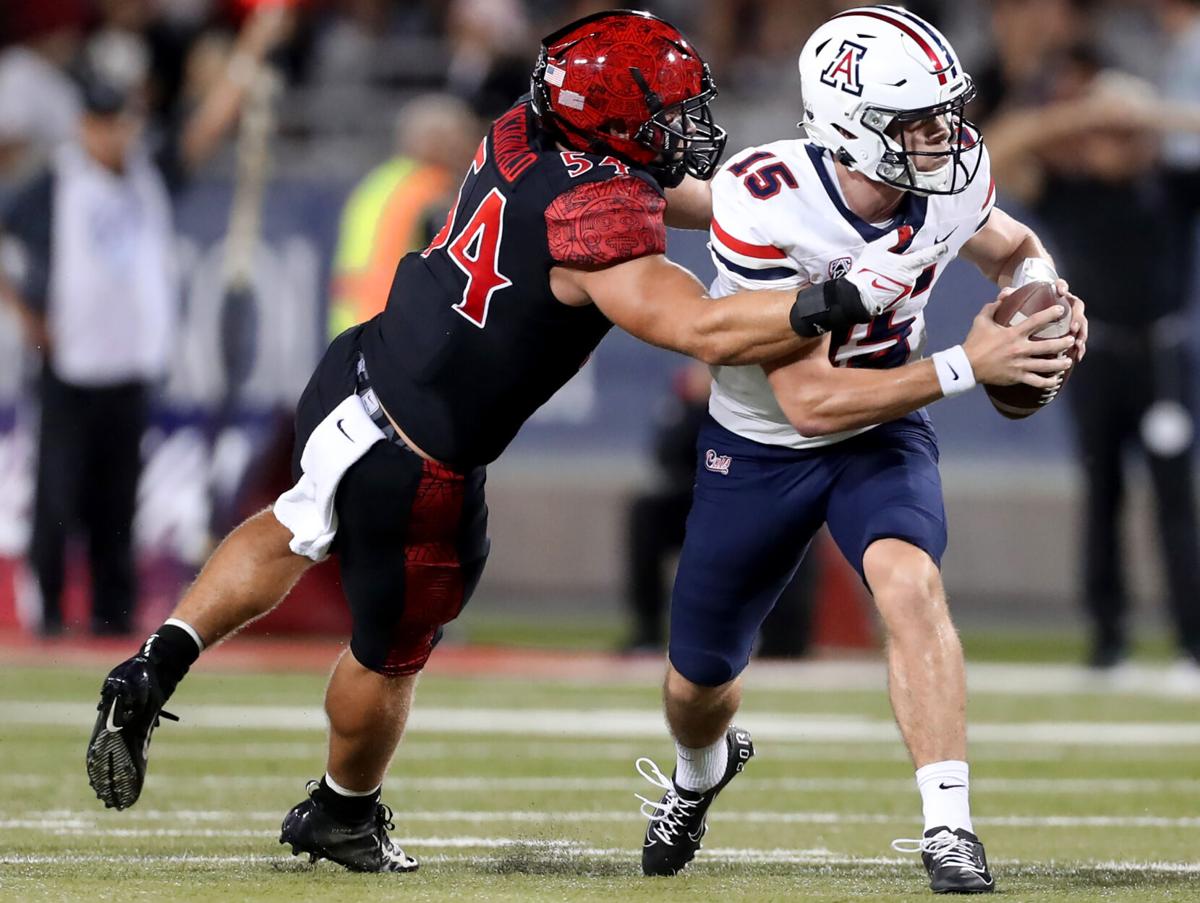
That’s when we got our first glimpse of Will Plummer, who’s replacing Gunner Cruz for Saturday’s game against NAU. We’re hesitant to attach any permanence to that assignment. We know better.
We also know what our eyes have seen during Arizona’s 0-2 start. Do the numbers back that up? That’s what we’re going to explore in this week’s “Cats Stats.”

Editor’s note
Each week throughout the football season, we’ll take an in-depth look at the Arizona Wildcats from a statistical perspective.
The numbers: 15, 3
The significance: The first figure is Arizona’s points per game; the second is its total number of offensive touchdowns so far. If it weren’t for the mystifyingly inept Washington offense, Arizona would rank last in the Pac-12 in both categories.
This is the most basic prism through which to examine QB performance, and one could argue it’s unfair given that football is a team sport played by 11 men on a side. But from Day 1, Jedd Fisch has stated that the quarterback who’s able to move the team most consistently — i.e., score the most points — would earn the job.
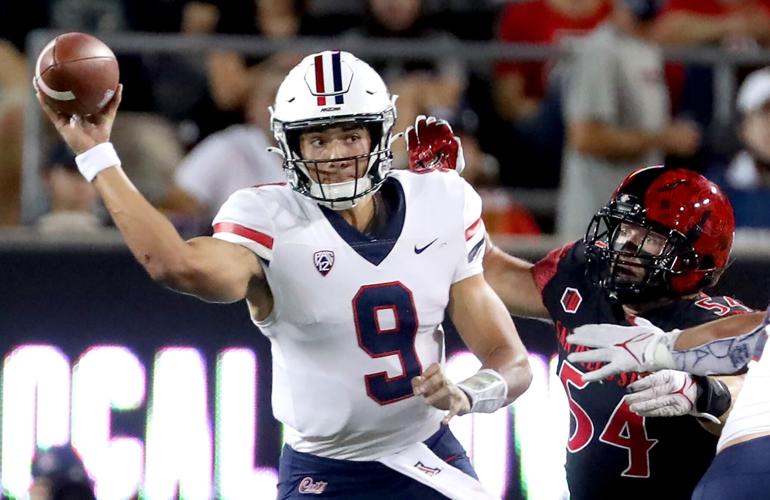
Cruz led 21 drives in the first two games. Only two produced touchdowns.
Points have been hard to come by for Arizona for a while, for a variety of reasons. The Wildcats scored 57 points in their first two games last season (including 21 against UW in the fourth quarter when the score was 44-6). Since then: 10, 13, 7, 16, 14.
The numbers: 7.5, 3.7
The significance: Those figures represent Cruz’s average yards per attempt in the first two games. As you can see, this key metric declined by half from Week 1 to Week 2.
The top 15 passers in FBS, by efficiency rating, average at least 9.1 yards per attempt. That group includes Plummer’s older brother, Jack, who’s the starting quarterback at Purdue.
Will Plummer’s average per attempt (5.9) is actually lower than Cruz’s (6.3). But there’s an explanation for that, and it can be found in the next item:
The numbers: 5.8, 10.6
The significance: Those figures are the average depth of target — or ADOT — for Cruz and Plummer so far this season, according to Pro Football Focus. Several factors can influence those numbers, including play-calling and game situation.
But Fisch has mentioned “missed opportunities” in the passing game several times, and he even put a number on it in Week 1 (150 yards). The implication is that receivers have been open down the field, but the quarterbacks haven’t connected with them.
The difference between the two quarterbacks is that Plummer at least has attempted those passes, leading to a lower completion percentage and a lower average per attempt.
According to PFF, 77% of Cruz’s pass attempts have been thrown less than 10 yards down the field. He’s 0 for 4 on passes thrown 20-plus yards.
Meanwhile, 65% of Plummer’s passes have been thrown less than 10 yards. He has thrown more passes of 20-plus yards (five) than Cruz despite having less than a third of his total attempts.
Just because you’re more willing to chuck the ball downfield doesn’t mean you’re making the right decisions or playing the position better. But it seems clear Fisch is looking for at least a little bit more of that.
To put Arizona’s ADOT figures in perspective, the top five passers in FBS by efficiency rating each have an ADOT of at least 8.0 yards. Four of the five are at 9.1 or higher.

Arizona quarterback Gunner Cruz has led the Wildcats to just two touchdowns in 21 drives this season.
The number: 53.0
The significance: That’s Plummer’s career completion percentage. It’s at least 12 percentage points lower than desired, and it’s a number that’s going to have to come up for Plummer to keep the job.
Does it mean Plummer is an inaccurate passer? Is he a victim of circumstances? Or is the sample size simply too small to tell?
Plummer wasn’t supposed to play at all last season, when he was a true freshman. Grant Gunnell was the clear starter. But on the first play of the UCLA game, Gunnell got hurt. Plummer had to enter without so much as a warmup toss.
Plummer finished that game 17 of 35 (48.6%). The following week, in his first career start, he went 19 of 32 (59.4%) vs. Colorado. The Wildcats actually led that game 13-0 in the second quarter. It’s the last time they held a lead.
Plummer’s next appearance came in relief against Arizona State. He completed 7 of 13 passes (53.8%) and led the Wildcats to their lone touchdown.
Plummer played one series against BYU, going 2 of 3 (66.7%). He was 8 of 17 (47.1%) against San Diego State. The score was 35-7 when he entered in the third quarter.
PFF’s metrics suggest Plummer is capable of better. Factoring in dropped passes, PFF gives Plummer an adjusted completion rate of 63.4%.

