In the season premiere of “Cats Stats” — published in late August, which feels like a lifetime ago — we cited six statistics that could shape the fate of the 2019 Arizona Wildcats.
With Arizona having reached the halfway point of its schedule, it’s time to revisit those stats and see how the Wildcats have fared — and whether those numbers have had the expected impact.
Khalil Tate’s rushing attempts. Back in August, we proposed that Tate averaging 9 to 10 carries per game would be “reasonable” and a “good sign for the Wildcats.” Technically, he’s in that range. But not really.
Tate has 44 “rushes” in five games, or 8.8 per game. However, he has been sacked eight times, and those count as carries in college football. So Tate actually has run the ball 36 times, which comes out to 7.2 per game.
That figure is up from last season, when Tate averaged 5.5 rushing attempts after adjusting for sacks. It’s still well below the 12.8 attempts he averaged in 2017.
We have seen flashes of “2017 Tate” this season. He rushed 13 times for 108 yards in the opener at Hawaii, nearly tying (or winning) the game on a last-gasp dash for the end zone. He carried 17 times for 129 yards — including a career-long 84-yard touchdown run — against Texas Tech.
Those 17 rushes tied for the third most in Tate’s career. He set a career high of 26 on Nov. 4, 2017, at USC. Tate and the Wildcats visit the Trojans on Saturday.
But on that 17th carry against the Red Raiders, Tate came up gimpy. He tweaked a hamstring and sat out the following game against UCLA.
Tate returned a week later against Colorado and passed for a career-high 404 yards and three touchdowns in a 35-30 UA victory. He rushed only four times for 23 yards, although the final play (excluding a kneel-down) was a quarterback sweep.
Half of Tate’s eight rushing attempts against Washington last week were sacks. He showed little inclination to run up the field. Unlike the Texas Tech game, the Wildcats did not try to slow the Huskies’ blitzes with designed QB runs. If Tate had opportunities to keep the ball on zone-read plays, he didn’t take them.
Is Tate playing at less than full capacity? Did Washington take away his running lanes? Is something else afoot?
Stay tuned on this one. It’s still evolving.
Tate’s completion percentage. This is an area where the senior quarterback unquestionably has improved.
Tate has completed passes at a rate of 64.8%, which would be a career high. Last year he connected on just 56.3%, which ranked last among qualifying Pac-12 quarterbacks.
Tate’s biggest improvement has come on third downs, where he has raised his completion percentage from 48.9% to 61%. He also has gotten considerably better in third-and-long situations. Last season, Tate completed just 40.7% of his passes when needing 6 or more yards on third down, per ESPN.com’s splits. He’s now at a respectable 51.7%.
Interestingly, there’s a sizable disparity in Tate’s completion rates in wins vs. losses. Tate has completed 72.8% of his passes in his three victories (NAU, Texas Tech, Colorado). He’s at 54.7% in his two losses (Hawaii, Washington).
The offense was slow to get going in both halves against the Rainbow Warriors. It never found a consistent rhythm against the Huskies. Tate missed a handful of open receivers in both games. He and the offensive line struggled with Washington’s pressure packages last week.
Red-zone touchdown percentage. This was a huge point of emphasis in the offseason, and the results have been positive so far.
Arizona has scored a touchdown on 70% of its trips into the red zone — up from 51.1% last season. The former ranks third in the Pac-12; the latter ranked 11th.
(Fun fact: The conference leader in red-zone TD rate is Oregon State at 78.3%. Bringing up the rear: Stanford, at 36.8%.)
The Wildcats were perfect in the red zone in wins over NAU, Texas Tech and Colorado. There’s no question that made a difference against the Red Raiders (a one-score game until 4:05 remaining) and the Buffaloes (a five-point game featuring nine lead changes).
Texas Tech went 2 of 3, coming away empty on a second-quarter possession that reached the UA 15-yard line. Colorado went 2 of 4, twice settling for field goals — including at the end of a fourth-quarter drive that reached the UA 2.
Arizona went 2 for 4 against Hawaii, and that proved costly. A fourth-quarter drive to the UH 13 ended with a Tate interception. The Wildcats could have taken the lead or tied the score. Instead, they surrendered a TD and trailed by 10. It remains the only red-zone interception of Tate’s career.
Arizona went 1 for 2 vs. Washington. The Wildcats appeared to have a touchdown on a J.J. Taylor run, but it was called back because of a holding penalty. The subsequent field goal made it 27-20 with 14:46 left. A touchdown probably wouldn’t have made a different in the end, but who knows?
The UCLA game is the lone anomaly thus far. Arizona scored a touchdown only once in four red-zone trips against the Bruins yet still won 20-17. The margin obviously would have been larger had the Wildcats cashed in on those opportunities.
Sacks. This is the big, bad one. Arizona has regressed here, and it’s hurting the team in multiple ways.
The Wildcats have only five sacks, which ranks last in the Pac-12 and is tied for 124th in the nation. Their average of 0.83 sacks per game is down significantly from last year’s 1.92 — which was down from the previous season’s 2.38.
As we’ve said repeatedly, sacks aren’t the only way to measure pass-rush effectiveness. Football Outsiders uses sack rates — and Arizona ranks in the bottom 10 nationally in all three of FO’s metrics.
Here’s another way to look at it: Arizona’s five sacks have generated 19 yards in losses, which ranks 128th in the country. Opponent sacks have generated 71 yards in losses — a differential of 52 yards.
When you include all tackles for losses, the differential is even greater — 70 yards. If you combine that with the Wildcats’ 6.8-yard deficit in net punting average, they’re losing about 18.5 yards of field position per game to their opponents. Add penalty yards to the mix, and that figure creeps over 20.
Jalen Harris leads the team with 3.5 sacks, which would have tied for the team lead at the end of last season. Almost every other Wildcat has failed to get to the quarterback.

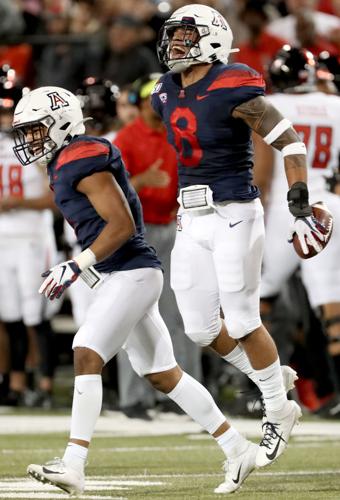
Anthony Pandy and the Wildcats’ defense had 10 takeaways in their first three games — but just two since.
Takeaways. If you believe there’s a correlation between pass-rush pressure and takeaways — a perfectly sensible supposition — Arizona’s lack of sacks is being felt here.
Don’t let the season-long takeaway total of 12 — just three shy of last year’s final tally — fool you. The Wildcats had 10 in their first three games, including six in the opener at Hawaii. They have had only two in the past three games.
Arizona defeated Texas Tech and Colorado despite a turnover margin of minus-1 in each game. The Wildcats weren’t so fortunate against the Huskies (minus-3).
Arizona didn’t force a fumble or intercept a pass in its past two games (its lone takeaway came on a muffed punt). It’s going to be extremely difficult to keep winning that way, especially against a second-half schedule filled with land mines.
Record in one-score games. The Wildcats were 2-4 in one-score games last season (final margin of eight or fewer points). They’re 2-1 so far this year.
The wins came over UCLA and Colorado. The loss came at Hawaii.
What’s been the difference? In the wins, Arizona did a better job of taking care of the ball in the second half and made a handful of clutch defensive stops. The Hawaii loss echoed last season’s narrow defeats, in which the UA offense made critical mistakes and the defense couldn’t get the other team off the field.
The Wildcats are likely to play more close games the rest of the way. Improvement in the stats listed above — especially Nos. 4 and 5 — would go a long way toward keeping their one-score record in the black.


