Editor’s note: Each week throughout the football season, we’ll take an in-depth look at the Arizona Wildcats from a statistical perspective.
Arizona’s recent staff shakeup and the Wildcats’ ongoing losing streak have shifted attention away from the team’s quarterback situation.
But it’s a safe bet the quarterbacks will be a prominent topic when Arizona commences game-week preparations for its Nov. 16 trip to Oregon after being off this weekend.
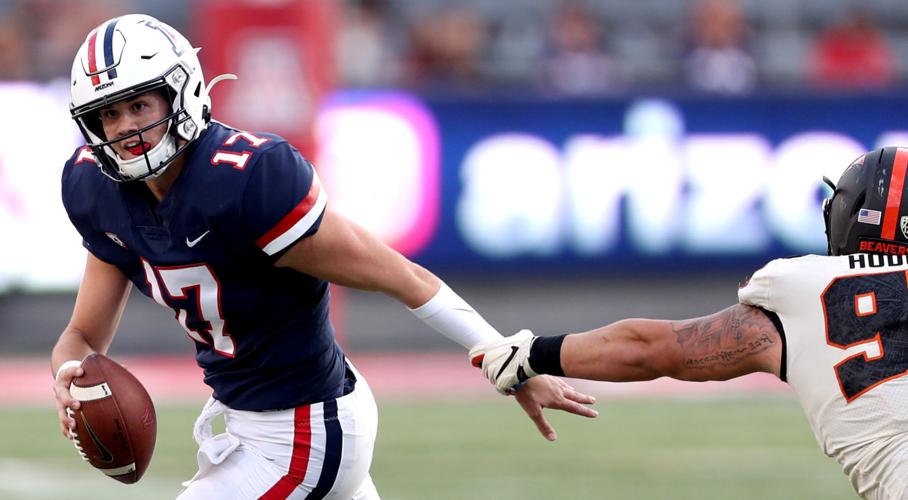
To review: Both Khalil Tate and Grant Gunnell have played in Arizona’s past four games. Tate started all four. He finished only one.
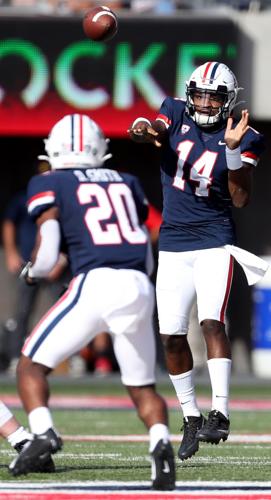
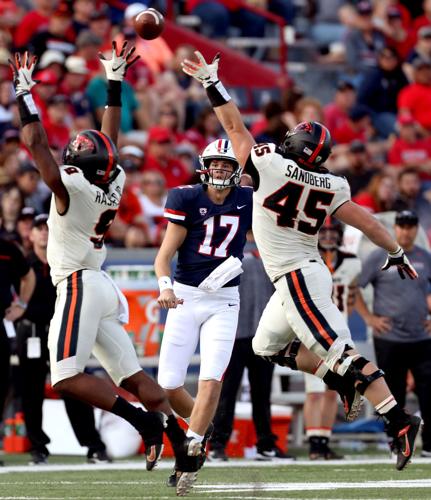
Kevin Sumlin and Noel Mazzone implemented a plan to rotate the two quarterbacks in the past two games. Gunnell, a true freshman, played the third and fourth series each time. He played one series in the second half at Stanford — the lone game Tate finished. Tate, a senior, played the first series of the second half against Oregon State before yielding to Gunnell for the rest of the afternoon.
The QB plan for the Oregon game wasn’t known as of this writing. It’s possible Sumlin will reveal it during his regularly scheduled news conference Monday. He could stick with the status quo, switch Tate’s and Gunnell’s roles or hand the keys to the promising freshman.
What are some of the numbers that might factor into that decision? That’s what we’re going to explore in this week’s edition of “Cats Stats.” As you’ll see, the figures illustrate some of the vital differences between the players and help explain why their roles have shifted.
TD-INT ratio
Tate has a 12-8 touchdown-to-interception ratio, or 1.5-1. It’s the worst ratio of his career, excluding his freshman year, and represents a significant step backward from last season.
In what was considered a disappointing campaign because of preseason expectations and injuries, Tate posted a 26-8 TD-INT ratio. With three games left, he already has matched the latter.
Tate’s eight interceptions are tied for third most in the Pac-12. Among the five quarterbacks with eight or more picks, Tate has the fewest touchdown passes. Only once this season, against NAU, has Tate had a game in which he threw a TD pass and didn’t throw an interception.
Gunnell has proved to be a better caretaker of the football, albeit in a smaller sample size. Gunnell has a 9-1 TD-INT ratio. His lone pick came on his first pass against USC, a play that saw him get drilled by a blitzing defender as he released the ball.
Tate has attempted 76 more passes, so the best way to compare their interception totals is by percentage. Tate’s rate is 4.4%. Gunnell’s is 0.8%.
One could argue that Gunnell plays a more conservative style than Tate and that at least partially explains the disparity. One also could argue that Gunnell’s style fits this particular Arizona team better. Some squads can withstand turnovers from a gunslinging quarterback. The 2019 Wildcats — who have encountered a bevy of issues on defense and special teams — cannot.
Yards per attempt

Khalil Tate has struggled to complete passes when pressured this season, according to Pro Football Focus.
Yards per attempt is one of the key metrics used to calculate passing efficiency (and passer rating in the NFL). Although he’s much more apt to check the ball down or throw a swing pass, Gunnell actually has a higher average per attempt than Tate.
Gunnell’s average is 8.5 yards. Tate’s is 8.1 — a career low, again, excluding his freshman year. Tate’s mark also has declined for the second straight season. It was 8.9 yards in 2017, 8.4 last year.
Given that Tate has a stronger arm and is more inclined to take shots downfield, how is it that Gunnell has a higher average? Well, for one thing, Gunnell has a higher completion percentage — 66.4 to Tate’s 62.2 (which is a career high, by the way). The other factor is that Gunnell operates the offense closer to the way it’s designed.
Take Gunnell’s 38-yard touchdown pass to Gary Brightwell against Oregon State last week. It was a swing pass thrown into the right flat. Brightwell caught the ball at about the 40-yard line. He did most of the work.
But Gunnell threw the ball on time to an open receiver and hit him in stride. His quick decision gave Brightwell an opportunity to set up a move and size up the defense.
Tate has been reluctant at times to dump the ball off to outlet receivers, and that has led to other issues. Which brings us to our next item.
Sack rate
According to our friends at Pro Football Focus, Tate has dropped back to pass 244 times this season. He has been sacked 18 times, for a sack rate of 7.4%.
Gunnell has dropped back 144 times. He has been sacked eight times. That’s a rate of 5.5%.
Holding the ball too long — or running out of bounds with it behind the line of scrimmage — has been a problem for Tate at times this season. He took two sacks on Arizona’s final possession of the second quarter against Oregon State, putting the Wildcats in an unmanageable third-and-31 situation. That, combined with unwise clock management, left the Beavers with just enough time to put together a touchdown drive in the last minute of the half.
Gunnell, meanwhile, displayed good pocket awareness and kept plays alive more often than not.
Tate obviously is able to offset lost yardage with running ability that far surpasses Gunnell’s. Even with 113 yards in sack losses, Tate has 312 net rushing yards and a 4.5-yard per-carry average. Gunnell has 16 yards and averages 0.8 yards per rush.
Under pressure

Arizona quarterback Grant Gunnell used Tuesday's news that the football season has been postponed indefinitely as a rallying cry.
These numbers are particularly damning for Tate.
Per PFF, Tate has faced pressure on 68 dropbacks. He has completed only 13 of 44 passes in those situations — 29.5% — for 173 yards with three touchdowns and two interceptions.
Gunnell has faced pressure on 47 dropbacks. He has completed 19 of 32 passes — 59.4% — for 203 yards with two TDs and one pick.
Tate’s struggles against the blitz began against Washington, and he really hasn’t been the same since. Leading up to that game, he had completed 67.5% of his passes, averaged 9.1 yards per attempt and had a 9-5 TD-INT ratio. Since then, those numbers have fallen to 54.3%, 6.9 and 3-3.
Tate also has 19 throwaways among his 76 incomplete passes, according to PFF. In other words, 25% of his incomplete passes have come in situations where he had no other choice — or believed he had no other choice — than to throw the ball away.
Gunnell has four throwaways among 42 incomplete passes, or 9.5%.
Fourth quarter
While he has improved markedly as a passer on third down — boosting his completion rate from 48.9% last year to 63.8% this year — Tate has regressed in the fourth quarter of games.
Tate has completed only 50% of his fourth-quarter passes, averaging 6.2 yards per attempt with a 0-4 TD-INT ratio. Those figures are all easily his worst in any period.
Gunnell is a 66.1% passer in the fourth quarter. He has averaged 7.4 yards per attempt with a 3-0 TD-INT ratio.
It’s important to note that a good chunk of Gunnell’s fourth-quarter snaps have come in “garbage time” — when the game basically was decided and defenses played more conservatively than they would have earlier in the game.
It’s also worth noting that Gunnell’s overall body of work is much smaller than Tate’s. The numbers the freshman has accumulated thus far might not paint a precise picture of his production or potential.
But they’re also all we have to go on. The majority show that Gunnell has outperformed Tate. If Sumlin truly believes, as he has stated multiple times, that “life pays off on results,” the QB plan moving forward should be obvious.


