After Noah Fifita made his first career start for Arizona, Wildcats tight end Tanner McLachlan was asked to compare the games of Fifita and fellow UA quarterback Jayden de Laura.
“That’s kind of a loaded question,” McLachlan said.
A week later, it still is — maybe more so.
It wouldn’t be accurate to say Arizona is in the midst of a quarterback controversy. UA coach Jedd Fisch has been steadfast in saying that de Laura will regain his starting spot once he’s fully recovered from an ankle injury.

But it’s a hot topic among Wildcat fans and followers after Fifita’s second straight impressive outing — a 303-yard, five-touchdown performance in Arizona’s 43-41 triple-overtime loss at then-No. 9 USC. Most of them are clamoring for Fifita to remain the starter.
Is that just recency bias? Or is Wildcat Nation onto something?
We’ll try to answer those questions in this Washington State edition of “Cats Stats” by doing something McLachlan wisely avoided: Compare the two quarterbacks.

The upstart Noah Fifita, or the experienced veteran Jayden de Laura? Arizona coach Jedd Fisch says there is no quarterback controversy; de Laura is his guy if 100% healthy. But what does the (somewhat limited) data say?
Fifita doesn’t have as big a body of work as de Laura, so it isn’t a perfect comparison. Only now do defensive coordinators have a decent amount of film on the redshirt freshman; opponents are sure to make adjustments to make it harder for Fifita to succeed.
On the flip side, Fifita hasn’t had the benefit of padding his stats against NAU and UTEP. His two starts have come against top-10 opponents.
Here’s how the two quarterbacks stack up in five categories we consider critical:
Accuracy
Fifita has been a more accurate passer. His completion rate of 73.2% ranks third in the Pac-12 behind Oregon’s Bo Nix (80.4%) and Washington’s Michael Penix Jr. (74.7%). Both have more than 130 passing attempts; Fifita has 60.
Even if you take out Fifita’s mop-up duty vs. NAU and UTEP (4 for 4), he’d be at 71.8%.
De Laura has completed a career-best 69.6% of his passes this season. His career mark as a Wildcat is 64.1%.

Arizona quarterback Jayden de Laura (7) throws a pass against Stanford during the first half of the Wildcats' Sept. 23 win over the Cardinal in Stanford, California. Heading into Arizona's matchup with Washington State, de Laura hasn't played since that win at Stanford. To date, it's also the last time Arizona was victorious this season.
Is Fifita’s figure higher because he doesn’t thrown downfield as much? At least one stat suggests that’s not the case at all.
Fifita has an average depth of target of 7.5 yards this season, according to Pro Football Focus. De Laura’s ADOT in 2023 is 7.1 yards.
Turnovers
This is another area where, at least so far, Fifita has the edge.
Fifita has an 8-2 touchdown-to-interception ratio this season. De Laura is sitting at 9-5 — the latter inflated by a four-interception outing against Mississippi State (de Laura’s second four-pick performance in a four-game span).
As a Wildcat, de Laura has a 34-18 TD-INT ratio — less than two to one. He has averaged just over one interception per game at the UA (1.13).
Fifita has thrown one interception in each of his two starts. That projects to 12 over a full season. De Laura had a league-high 13 last year.
PFF tracks turnover-worthy plays — passes that have a high percentage chance of being intercepted as well as any instance of carelessly taking care of the ball.
PFF has charged de Laura with eight TWP this season, tied for second most in the Pac-12. His TWP rate is 5.4%. Last year those numbers were 24 (most in the conference) and 4.5%.
Fifita has three TWP this season, and his TWP rate is 2.9%.
Big plays
For most of his career, de Laura has been more of a gunslinger than what we’ve seen so far from Fifita. That’s reflected in the numbers.
PFF has a stat called “Big Time Throws,” which it defines as passes “with excellent ball location and timing, generally thrown further down the field and/or into a tighter window.”
De Laura has 36 BTT in 16 games at Arizona — an average of 2.25 per game. PFF has credited Fifita with only one such throw this season.
De Laura has a higher average per attempt than Fifita by more than a yard — 8.5 vs. 7.3. De Laura averaged 8.4 yards per attempt last year.
On passes thrown 20-plus yards downfield, the two quarterbacks have connected at an almost identical rate. De Laura has hit on 39.6% of those deep shots as a Wildcat. Fifita is at 40% this season.
De Laura’s passes of 20-plus yards haver produced more yardage per attempt (12.9 vs. 11.8) but also more interceptions (seven in 96 attempts vs. zero in 10 for Fifita).
Interestingly, de Laura has been less of a risktaker this season than last. De Laura has thrown the ball 20-plus yards on 12.1% of the throws PFF has charted this season — almost identical to Fifita’s rate of 12.2%. De Laura’s mark last year was 19.4%.
Escapability
De Laura is better at getting away from pressure.
PFF measures a quarterback’s ability to do that very thing. The stat is calls P2S% — percentage of pressures turned into sacks.
De Laura is sitting at 12.2% this season. His P2S% last year was 16.6%. Put another way, de Laura was sacked only one of six times, on average, when pressured in 2022.

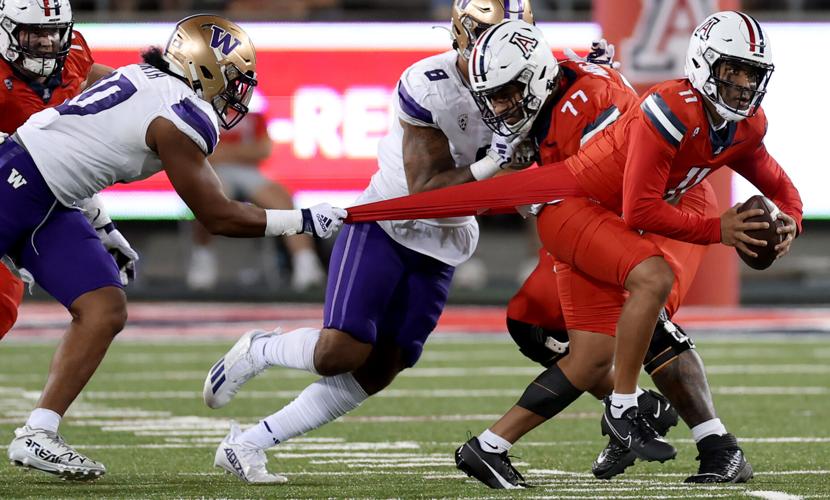
Washington linebacker Ralen Goforth (10) uses every inch of Arizona quarterback Noah Fifita's shirt (11) to try to slow the redshirt freshman and force him into throwing a pick in the third quarter of the Huskies' 31-24 win over the Wildcats last weekend at Arizona Stadium.
Fifita’s P2S% this season is 21.7%. He gets sacked roughly one time per five pressures.
Fifita has proved more sackable despite getting rid of the ball, on average, almost half a second faster than de Laura. Fifita’s average time to throw (TTT) this season is 2.73 seconds, per PFF. De Laura’s is 3.21.
De Laura’s TTT is the highest in the Pac-12 among passers with at least 62 dropbacks. That’s mainly a product of his ability and willingness to keep plays alive. USC’s Caleb Williams is second at 3.13 seconds.
Handling pressure
This is another way to look at how quarterbacks deal with defenders bearing down on them. When they throw the ball in the face of pressure, what happens?
Many of the metrics here favor Fifita (again acknowledging the smaller sample size).
De Laura has completed 47.4% (72 of 152) of his pass attempts when pressured as a Wildcat, per PFF. He has averaged 7.7 yards per attempt on those throws with a 7-9 TD-INT ratio.

While Noah Fifita, left, has proved to be more accurate and less turnover-prone, UA counterpart Jayden de Laura makes more big plays and is better at avoiding the pass rush.
Fifita is a 57.1% passer (8 of 14) when pressured this season. He has a 2-1 TD-INT ratio but has averaged just 3.9 yards per attempt on those throws.
When blitzed, de Laura has completed 61.4% of his passes over the past two seasons with an average per attempt of 8.4 yards and a 17-8 TD-INT ratio.
Fifita has completed 80% of his passes when blitzed (24 of 30) with an average per attempt of 8.0 yards and a 5-1 TD-INT ratio, according to PFF.
There’s another way to judge how quarterbacks handle pressure — how they fare on third downs. It’s less literal but no less important.
De Laura has completed 54.8% of his passes on third down (68 of 124) as a Wildcat, per ESPN.com. He has averaged 7.5 yards per attempt with a 4-6 TD-INT ratio.
Fifita is a 78.3% passer on third down (18 of 23) this season. He has averaged 5.2 yards per attempt with two touchdowns and zero picks.
Fifita’s completion rate on third down is his highest on any down.


