

 For decades, sperm counts and sperm health have been declining. Carol Yepes/Moment via Getty Images
In the U.S., nearly 1 in 8 couples struggles with infertility. Unfortunately, physicians like me who specialize in reproductive medicine are unable to determine the cause of male infertility around 30% to 50% of the time. There is almost nothing more disheartening than telling a couple “I don’t know” or “There’s nothing I can do to help.”
Upon getting this news, couple after couple asks me questions that all follow a similar line of thinking. “What about his work, his cellphone, our laptops, all these plastics? Do you think they could have contributed to this?”
What my patients are really asking me is a big question in male reproductive health: Does environmental toxicity contribute to male infertility?
Male fertility decline
 If a couple is struggling to get pregnant, doctors will try to figure out the cause. Philippe Roy/Cultura via Getty Images
Infertility is defined as a couple’s inability to get pregnant for one year despite regular intercourse. When this is the case, doctors evaluate both partners to determine why.
For men, the cornerstone of the fertility evaluation is semen analysis, and there are a number of ways to assess sperm. Sperm count – the total number of sperm a man produces – and sperm concentration – number of sperm per milliliter of semen – are common measures, but they aren’t the best predictors of fertility. A more accurate measure looks at the total motile sperm count, which evaluates the fraction of sperm that are able to swim and move.
A wide range of factors – from obesity to hormonal imbalances to genetic diseases – can affect fertility. For many men, there are treatments that can help. But starting in the 1990s, researchers noticed a concerning trend. Even when controlling for many of the known risk factors, male fertility appeared to have been declining for decades.
In 1992, a study found a global 50% decline in sperm counts in men over the previous 60 years. Multiple studies over subsequent years confirmed that initial finding, including a 2017 paper showing a 50% to 60% decline in sperm concentration between 1973 and 2011 in men from around the world.
These studies, though important, focused on sperm concentration or total sperm count. So in 2019, a team of researchers decided to focus on the more powerful total motile sperm count. They found that the proportion of men with a normal total motile sperm count had declined by approximately 10% over the previous 16 years.
The science is consistent: Men today produce fewer sperm than in the past, and the sperm are less healthy. The question, then, is what could be causing this decline in fertility.
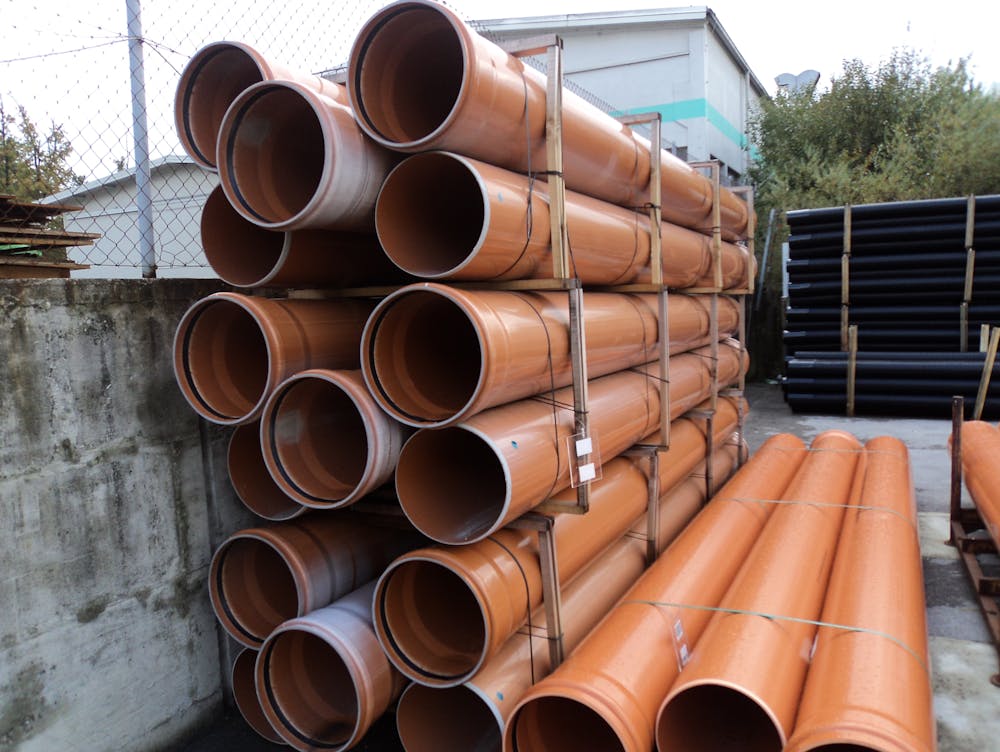 Plasticizers are common endocrine-disrupting compounds, found in many plastics – like PVC pipes – that come in contact with food or water. Mm Zaletel/Wikimedia Commons, CC BY-SA
Environmental toxicity and reproduction
Scientists have known for years that, at least in animal models, environmental toxic exposure can alter hormonal balance and throw off reproduction. Researchers can’t intentionally expose human patients to harmful compounds and measure outcomes, but we can try to assess associations.
As the downward trend in male fertility emerged, I and other researchers began looking more toward chemicals in the environment for answers. This approach doesn’t allow us to definitively establish which chemicals are causing the male fertility decline, but the weight of the evidence is growing.
A lot of this research focuses on endocrine disrupters, molecules that mimic the body’s hormones and throw off the fragile hormonal balance of reproduction. These include substances like phthalates – better known as plasticizers – as well as pesticides, herbicides, heavy metals, toxic gases and other synthetic materials.
Plasticizers are found in most plastics – like water bottles and food containers – and exposure is associated with negative impacts on testosterone and semen health. Herbicides and pesticides abound in the food supply and some – specifically those with synthetic organic compounds that include phosphorus – are known to negatively affect fertility.
Air pollution surrounds cities, subjecting residents to particulate matter, sulfur dioxide, nitrogen oxide and other compounds that likely contribute to abnormal sperm quality. Radiation exposure from laptops, cellphones and modems has also been associated with declining sperm counts, impaired sperm motility and abnormal sperm shape. Heavy metals such as cadmium, lead and arsenic are also present in food, water and cosmetics and are also known to harm sperm health.
Endocrine-disrupting compounds and the infertility problems they cause are taking a significant toll on human physical and emotional health. And treating these harms is costly.
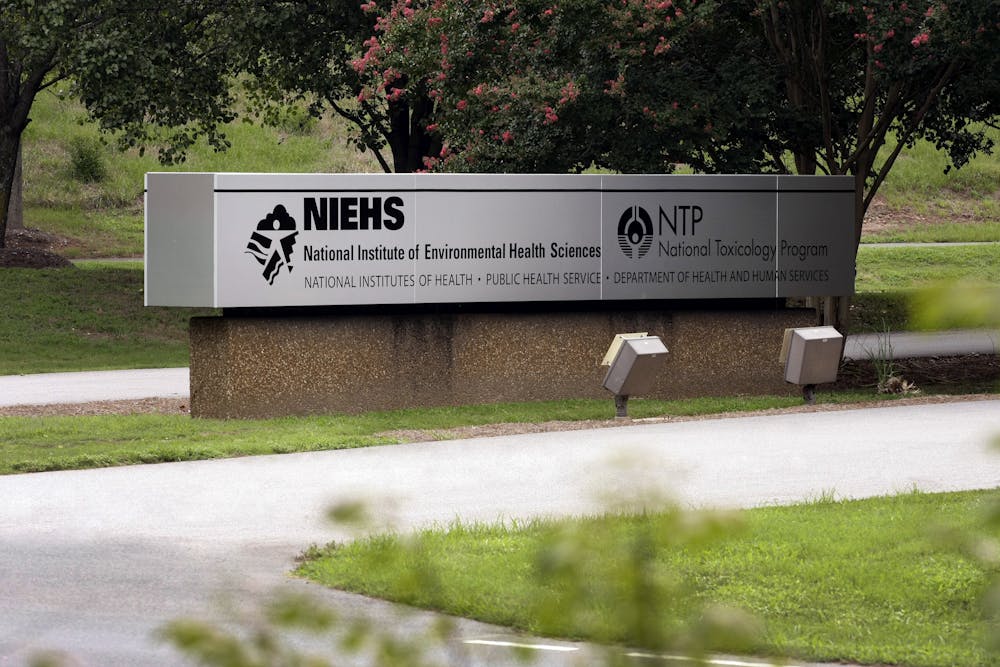 The National Toxicology Program is in charge of regulating the thousands of new chemicals that are introduced every year. National Institutes of Health
The effects of unregulated chemicals
A lot of chemicals are in use today, and tracking them all is incredibly difficult. Today, more than 80,000 chemicals are registered with the National Toxicology Program. When the program was founded in 1978, 60,000 of those were grandfathered into the program with minimal information, and nearly 2,000 new chemicals are introduced each year. Many scientists believe that the safety testing for health and environmental risks is not strong enough and that the rapid development and introduction of new chemicals challenges the ability of organizations to test long-term risks to human health.
Current U.S. national toxicology regulations follow the principle of innocent until proved guilty and are less comprehensive and restrictive than similar regulations in Europe, for example. The World Health Organization recently identified 800 compounds capable of disrupting hormones, only a small fraction of which have been tested.
A trade group, the American Chemistry Council, says on its website that manufacturers “have the regulatory certainty they need to innovate, grow, create jobs and win in the global marketplace – at the same time that public health and the environment benefit from strong risk-based protections.”
But the reality of the current regulatory system in the U.S. is that chemicals are introduced with minimal testing and taken off the market only when harm is proved. And that can take decades.
Dr. Niels Skakkebaek, the lead researcher on one of the first manuscripts on decreasing sperm counts, called the male fertility decline a “wake-up call to all of us.” My patients have provided a wake–up call for me that increased public awareness and advocacy are important to protect global reproductive health now and in the future. I’m not a toxicologist and can’t identify the cause of the infertility trends I’m seeing, but as physician, I am concerned that too much of the burden of proof is falling on the human body and people who become my patients.
___![]()
Ryan P. Smith receives funding from a Virginia Catalyst grant for male contraceptive research.
___
Top 10 US counties with the worst air pollution
Top 10 US counties with the worst air pollution
Updated
Air pollution arguably started when humans first learned how to harness the power of fire, and it became the modern curse of industry, automobiles, and power plants.
Today, in the time of COVID-19, dirty air is even more dangerous to our health. Not only has the pandemic caused the deaths of hundreds of thousands of people in the United States alone, but, according to the National Institute of Environmental Health Sciences (NIEHS), many of the pre-existing conditions that put some segments of the population at greater risk of serious complications from COVID may be linked to long-term exposure to air pollution.
Is there a connection between air pollution and severity of COVID-19?
A study by scientists at Harvard University looked at whether long-term average exposure to fine particulate matter (PM2.5) was associated with a higher risk of dying from COVID-19 in the United States.
By comparing PM2.5 data to the Johns Hopkins University count of COVID-19 deaths in more than 3,000 counties in the spring of 2020, they found long-term average exposure to this type of pollution was associated with worse outcomes from COVID-19.
Air pollution levels by county in the U.S. 2000–2016
Using air pollution data from 2000–2016, FindCare created this map of air pollution by county in the United States.

What is particulate matter?
Particulate matter, or particle pollution, is composed of particles mixed with liquid droplets in the air that can be inhaled and that may be detrimental to your health.
Some particles like soot are large, while others, like those 2.5 micrometers or smaller, are not visible to the naked eye. Most originate in pollutants created by cars, industry, and power plants.
Air pollution may be deadly
The findings of the Harvard Study were significant and alarming. They found an association between long-term exposure to PM2.5 air pollution and death from COVID-19.
The United States adopted the Air Pollution Control Act of 1955, the first federal clean air legislation, several years after 20 people died and more than 7,000 others became sick due to extreme air pollution over Donora, Pennsylvania, in 1948.
The Clean Air Act of 1990 in particular regulated the emission of pollutants from industry and motor vehicles. Nevertheless, experts and scientists have worried that over time, low-level exposure to air pollutants could endanger public health—concerns now underscored by the devastation of COVID-19.
For more information, review this chart to see the top 20 worst cities for air quality.
FindCare ranked the top 10 counties according to their average PM2.5 pollution from 2000 to 2016. They also mapped out the average PM2.5 pollution for all available counties. Here are the results.
#10. Clayton County, Georgia
Updated
- Average fine particulate matter pollution, 2000-2016: 13.7 μg/m^3
--- 14.2% above EPA standard
- Worst year: 2000 (18.5 μg/m^3 annual average)
- Best year: 2013 (9.4 μg/m^3 annual average)
A 2018 study by the American Lung Association, using data from the U.S. Environmental Protection Agency, found disturbing levels of particle pollution as recently as 2005, but have also found improvements since then in Clayton County, Georgia.
Located south of Atlanta, Clayton County is home to Hartsfield–Jackson Atlanta International Airport, the world’s busiest airport, and Interstate 75, which carries traffic to and from Atlanta and the surrounding metropolitan area.
#9. Jefferson County, Alabama
Updated
- Average fine particulate matter pollution, 2000-2016: 13.8 μg/m^3
--- 14.6% above EPA standard
- Worst year: 2000 (19.0 μg/m^3 annual average)
- Best year: 2015 (9.7 μg/m^3 annual average)
Once a center of iron, coal, and limestone mining, Jefferson County is the most populous in Alabama. Census data shows that an estimated 16.3% of people live below the federal poverty level in the county, which comprises the Birmingham metropolitan area.
Research has repeatedly linked poverty and homelessness with pollution in various ways. According to a 2017 report from The Lancet Commission on pollution and health, almost 92% of pollution-related deaths worldwide happen in low- and middle-income communities. Regardless of economics, pollution-related disease primarily affects minority and marginalized people.
#8. Hamilton County, Ohio
Updated
- Average fine particulate matter pollution, 2000-2016: 13.8 μg/m^3
--- 14.9% above EPA standard
- Worst year: 2005 (17.4 μg/m^3 annual average)
- Best year: 2016 (10.1 μg/m^3 annual average)
Hamilton County in southernmost Ohio includes metropolitan Cincinnati and lies across the Ohio River from Kentucky. It’s home to several Fortune 500 companies and their manufacturing factories, including grocery giant Kroger and consumer products conglomerate Procter & Gamble.
In 1906, the Smoke Abatement League was established by the Cincinnati Women’s Club to fight smoke and air pollution in Cincinnati. They created the Office of the Chief Smoke Inspector, one of the first agencies to help enforce community smoke regulations. Today, it’s part of the Southwest Ohio Air Quality Agency, which monitors air pollution and provides real-time air quality data to the public.
#7. Vanderburgh County, Indiana
Updated
- Average fine particulate matter pollution, 2000-2016: 13.8 μg/m^3
--- 15.2% above EPA standard
- Worst year: 2000 (18.0 μg/m^3 annual average)
- Best year: 2016 (10.2 μg/m^3 annual average)
Southwestern Indiana’s Vanderburgh County is home to the city of Evansville, which has historically been surrounded by a heavy concentration of coal-fired power plants. The area has been a target of the Sierra Club’s Beyond Coal Campaign promoting renewable energy.
#6. Fulton County, Georgia
Updated
- Average fine particulate matter pollution, 2000-2016: 13.8 μg/m^3
--- 15.2% above EPA standard
- Worst year: 2000 (18.9 μg/m^3 annual average)
- Best year: 2013 (9.3 μg/m^3 annual average)
Fulton County got a failing grade in a 2019 assessment of its ozone levels by the American Lung Association, using federal environmental data. Ground-level ozone forms when pollutants emitted by vehicles, power plants, and other sources react in sunlight, according to the EPA.
Heavily trafficked Interstates 20, 75, and 85 all converge in Atlanta—at the heart of Fulton County in what is called the Downtown Connector.
#5. Marion County, Indiana
Updated
- Average fine particulate matter pollution, 2000-2016: 14.3 μg/m^3
--- 19.3% above EPA standard
- Worst year: 2005 (17.9 μg/m^3 annual average)
- Best year: 2016 (10.4 μg/m^3 annual average)
Marion is Indiana’s largest county, and it is where Indianapolis is located. Enforcement of air quality standards in Indiana is highly dependent on federal standards. Under Indiana law, state environmental rules cannot be more stringent than those set by the federal government.
#4. Tulare County, California
Updated
- Average fine particulate matter pollution, 2000-2016: 14.5 μg/m^3
--- 20.8% above EPA standard
- Worst year: 2002 (18.7 μg/m^3 annual average)
- Best year: 2010 (11.9 μg/m^3 annual average)
Situated between Bakersfield and Fresno, Tulare County’s top commodity is milk, producing more than any other county in the nation. Famously home to more cows than humans, livestock is a huge contributor to methane emissions, which negatively impacts the climate and human health.
In 2019, conservation groups came to an agreement with the county that would help lower pollution from industrial dairies through the generation of renewable energy among other efforts.
#3. Fresno County, California
Updated
- Average fine particulate matter pollution, 2000-2016: 15.5 μg/m^3
--- 29.2% above EPA standard
- Worst year: 2000 (19.4 μg/m^3 annual average)
- Best year: 2016 (12.2 μg/m^3 annual average)
Findings by the American Lung Association, based on Environmental Protection Agency data, give Fresno failing grades for its ozone level, 24-hour particle pollution, and annual particle pollution level.
The EPA has launched efforts in the region, at the heart of the heavily agricultural San Joaquin Valley, to promote clean farming technology such as electric tractors and hybrid and zero-emission vehicles for dairies and farms, solar-powered composting and irrigation pumps to replace those powered by diesel and cleaner alternatives for disposing of the paper trays used to dry hand-harvested raisin grapes that are traditionally burned after use.
#2. Los Angeles County, California
Updated
- Average fine particulate matter pollution, 2000-2016: 15.7 μg/m^3
--- 31.0% above EPA standard
- Worst year: 2001 (21.6 μg/m^3 annual average)
- Best year: 2015 (12.2 μg/m^3 annual average)
Air quality in Southern California has gotten vastly better not only in recent decades, but it has undergone dramatic improvements since the 1950s when Los Angeles was notorious for smog so thick that it could limit visibility to a few city blocks.
Fueling the dirty air was a lack of public transportation, long commutes, an extensive freeway system, and a booming economy.
#1. Orange County, California
Updated
- Average fine particulate matter pollution, 2000-2016: 15.8 μg/m^3
--- 31.6% above EPA standard
- Worst year: 2001 (22.0 μg/m^3 annual average)
- Best year: 2015 (12.5 μg/m^3 annual average)
Nearly 3.2 million people live in Orange County, where, in 2006, 70% of voters approved a 30-year half-cent sales tax to help reduce transportation-related air pollution through less freeway congestion and expanded public transit.
In a link between air quality and COVID-19, in late January, local officials suspended limits on Orange County crematoriums, which are typically subject to regulations on the number of human remains incinerated due to potential impacts on air quality. The limits were lifted due to the substantial increase in the number of deaths due to COVID-19.
Continue reading to see the air pollution rankings of 50 counties in the U.S. and search for others.

