

A Michigan judge is putting sponges in the hands of shoplifters, ordering them to wash cars in a Walmart parking lot when spring arrives.
Judge Jeffrey Clothier hopes the unusual form of community service discourages people from stealing from Walmart and rewards shoppers who could see higher prices, or possibly lose stores, if thefts continue. The car washes will be free.
"I don't think everybody that steals is a bad person. Sometimes people are just down on their luck," said Clothier, who was recently elected to Genesee County District Court. "But there's going to be consequences when you break the law."

Shoppers head in and out of a Walmart store Feb. 7 in Englewood, Colo.
Clothier told The Associated Press that he began ordering "Walmart wash" sentences this week for misdemeanor shoplifting at the store in Grand Blanc Township, 50 miles (80 kilometers) north of Detroit. He believes 75 to 100 people eventually will be ordered to wash cars at weekend events at that location in March and April.
The judge said Walmart is "on board" and will provide water and supplies. The company's Arkansas headquarters didn't immediately respond to an email seeking comment Friday.
Clothier said he was shocked to see the breadth of retail thefts when he joined the bench in January, adding that offenders were from all over Michigan and outside the state.
"It's just crazy," he said, noting he had 48 such cases on his docket one day.
"I think it will be humiliating to be out there washing cars if you see someone you know," Clothier said.
Walmart designated a parking space for police because of frequent calls about thefts, township Supervisor Scott Bennett said.
"It's an innovative approach," county Prosecutor David Leyton said of the car washes. "Even if it deters one person, then there's some success there."
Shoplifters won't be the only people up to their elbows in suds.
"I will be there washing cars with them," the judge said.


The 25 cities with the highest car theft rates in the US
The car theft capitals of America
Updated Photo Credit: Alamy Stock Photo
Crime in the U.S. has trended downward since the early 1990s, and new data from the University of Pennsylvania suggests that COVID-19 has caused these numbers to drop even further across the nation’s largest cities. Since the onset of the pandemic, property crime, violent crime, and drug crime all experienced double-digit percentage declines when compared to averages over the previous five year period—a trend attributed to more residents staying home.
Despite sharp decreases in overall crime this year, car thefts rose dramatically in certain cities. Nearly 750,000 vehicles (or 228 per 100,000 residents) are stolen in the U.S. each year, representing a loss of about $6 billion annually. While car theft rates have long trended downward alongside overall crime rates, there appears to be a divergence amid the pandemic. This could be due to high unemployment rates combined with drivers not checking in on their parked vehicles as frequently.
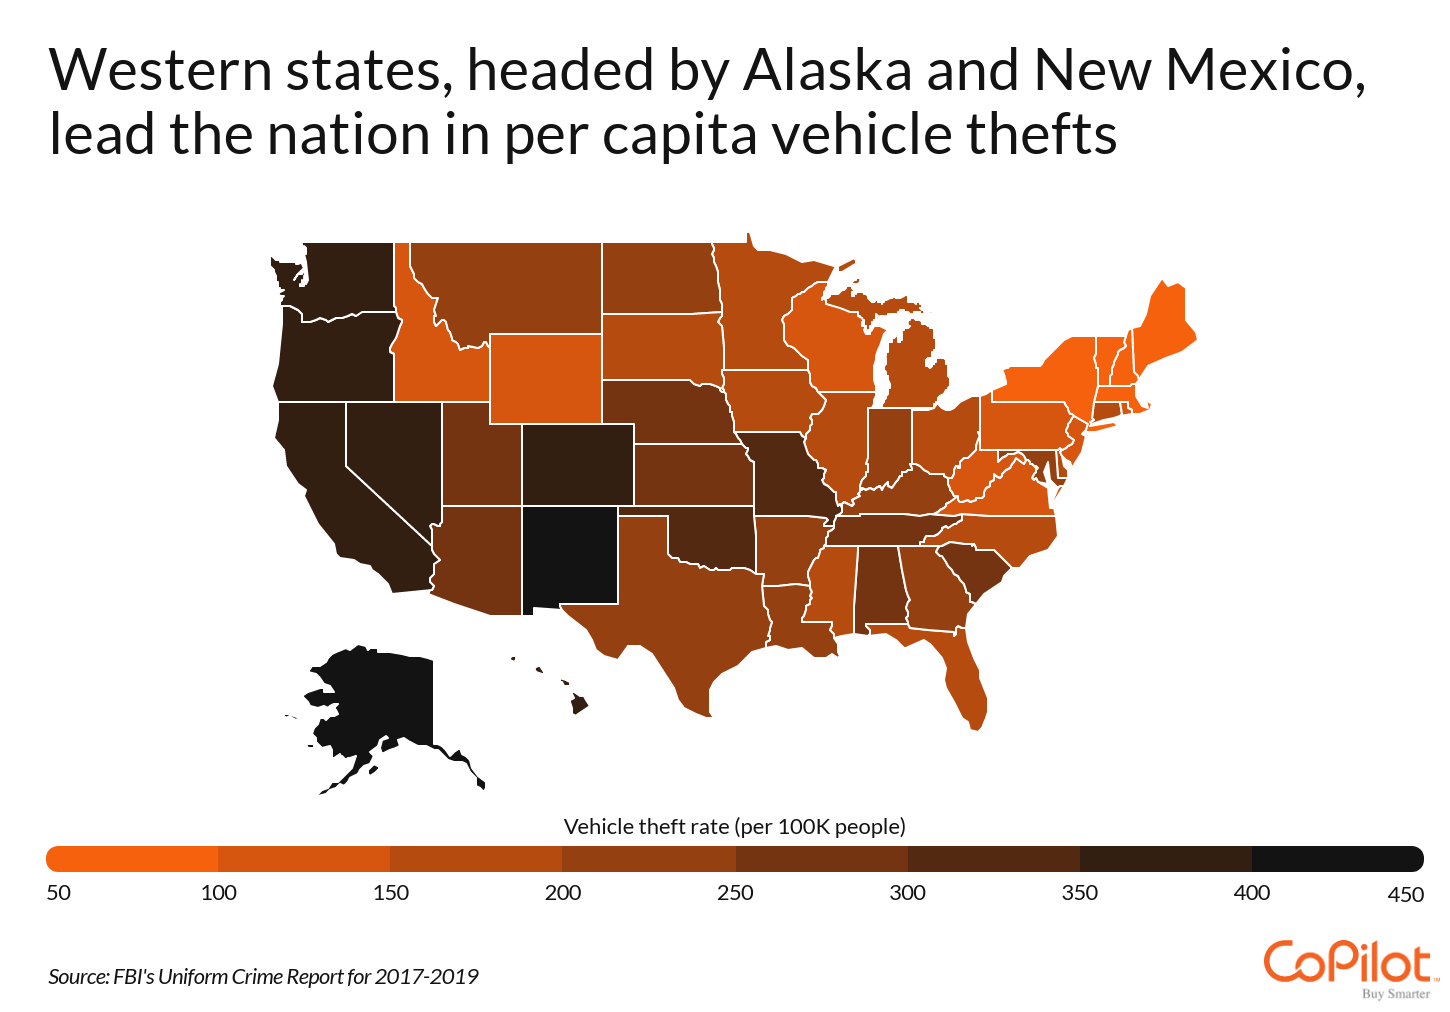
Car thefts vary significantly on a geographic level. At the state level, Alaska and New Mexico have historically reported the highest motor vehicle theft rates, at 495 and 488 car thefts per 100,000 people, respectively, over the past three years. In general, Western states report higher rates of motor vehicle theft than those in the Northeast or Midwest. Vermont and Maine boast the lowest car theft rates in the country at just 57 and 42 thefts per 100,000 people.
To determine the car theft capitals of the U.S., researchers at CoPilot analyzed the last three years of crime data from the FBI. Cities were ranked according to their average annual motor vehicle theft rate per 100,000 people based on data from 2017 to 2019. Researchers also calculated the average annual number of motor vehicle thefts, the overall property theft rate, and the violent crime rate for the same years. To improve relevance, only the 150 largest cities in the U.S. were included in the analysis.
Here are the cities with the most vehicle thefts per capita.
25. Wichita, Kansas
Updated- Motor vehicle theft rate: 646 per 100k people
- Average annual motor vehicle thefts: 2,519
- Overall property theft rate: 5,505 per 100k people
- Violent crime rate: 1,117 per 100k people

Photo Credit: Alamy Stock Photo
24. Dallas, Texas
Updated- Motor vehicle theft rate: 680 per 100k people
- Average annual motor vehicle thefts: 9,277
- Overall property theft rate: 3,232 per 100k people
- Violent crime rate: 796 per 100k people

Photo Credit: Alamy Stock Photo
23. Omaha, Nebraska
Updated- Motor vehicle theft rate: 693 per 100k people
- Average annual motor vehicle thefts: 3,259
- Overall property theft rate: 3,606 per 100k people
- Violent crime rate: 597 per 100k people

Photo Credit: Alamy Stock Photo
22. San Jose, California
Updated- Motor vehicle theft rate: 702 per 100k people
- Average annual motor vehicle thefts: 7,299
- Overall property theft rate: 2,444 per 100k people
- Violent crime rate: 423 per 100k people
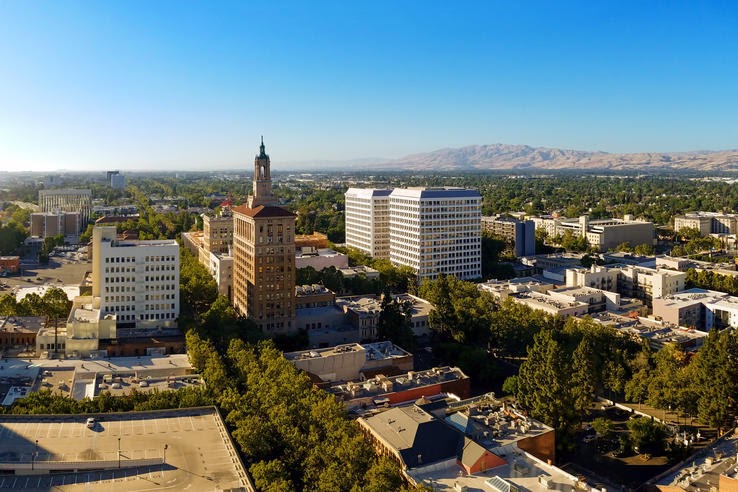
Photo Credit: Alamy Stock Photo
21. Newark, New Jersey
Updated- Motor vehicle theft rate: 705 per 100k people
- Average annual motor vehicle thefts: 1,983
- Overall property theft rate: 2,024 per 100k people
- Violent crime rate: 753 per 100k people

Photo Credit: Alamy Stock Photo
20. Spokane, Washington
Updated- Motor vehicle theft rate: 710 per 100k people
- Average annual motor vehicle thefts: 1,565
- Overall property theft rate: 6,681 per 100k people
- Violent crime rate: 699 per 100k people

Photo Credit: Alamy Stock Photo
19. New Orleans, Louisiana
Updated- Motor vehicle theft rate: 716 per 100k people
- Average annual motor vehicle thefts: 2,825
- Overall property theft rate: 4,716 per 100k people
- Violent crime rate: 1,148 per 100k people

Photo Credit: Alamy Stock Photo
18. Bakersfield, California
Updated- Motor vehicle theft rate: 727 per 100k people
- Average annual motor vehicle thefts: 2,821
- Overall property theft rate: 4,095 per 100k people
- Violent crime rate: 471 per 100k people
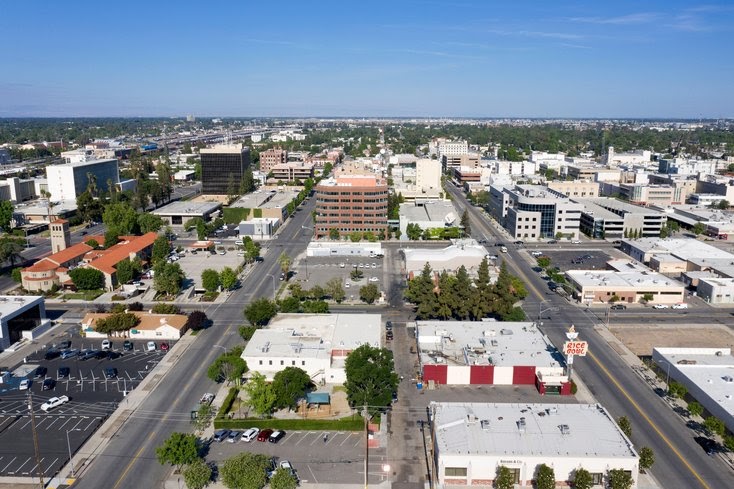
Photo Credit: Alamy Stock Photo
17. St. Paul, Minnesota
Updated- Motor vehicle theft rate: 730 per 100k people
- Average annual motor vehicle thefts: 2,266
- Overall property theft rate: 3,462 per 100k people
- Violent crime rate: 611 per 100k people

Photo Credit: Alamy Stock Photo
16. Denver, Colorado
Updated- Motor vehicle theft rate: 738 per 100k people
- Average annual motor vehicle thefts: 5,376
- Overall property theft rate: 3,643 per 100k people
- Violent crime rate: 709 per 100k people

Photo Credit: Alamy Stock Photo
15. Chattanooga, Tennessee
Updated- Motor vehicle theft rate: 748 per 100k people
- Average annual motor vehicle thefts: 1,360
- Overall property theft rate: 5,817 per 100k people
- Violent crime rate: 1,053 per 100k people

Photo Credit: Alamy Stock Photo
14. Baltimore, Maryland
Updated- Motor vehicle theft rate: 753 per 100k people
- Average annual motor vehicle thefts: 4,495
- Overall property theft rate: 4,643 per 100k people
- Violent crime rate: 1,933 per 100k people
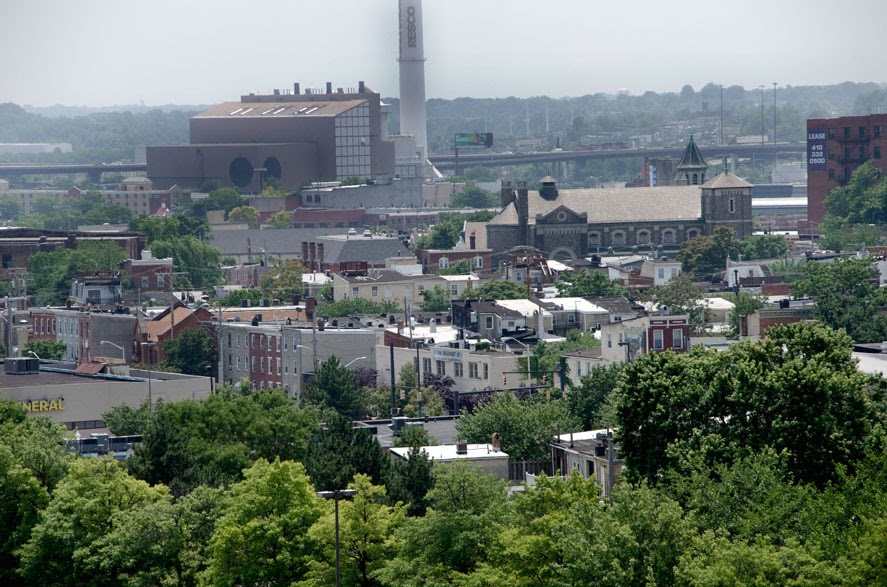
Photo Credit: Alamy Stock Photo
13. Salt Lake City, Utah
Updated- Motor vehicle theft rate: 764 per 100k people
- Average annual motor vehicle thefts: 1,546
- Overall property theft rate: 6,531 per 100k people
- Violent crime rate: 763 per 100k people

Photo Credit: Alamy Stock Photo
12. Milwaukee, Wisconsin
Updated- Motor vehicle theft rate: 764 per 100k people
- Average annual motor vehicle thefts: 4,514
- Overall property theft rate: 3,123 per 100k people
- Violent crime rate: 1,455 per 100k people

Photo Credit: Alamy Stock Photo
11. Cleveland, Ohio
Updated- Motor vehicle theft rate: 798 per 100k people
- Average annual motor vehicle thefts: 3,048
- Overall property theft rate: 4,624 per 100k people
- Violent crime rate: 1,516 per 100k people
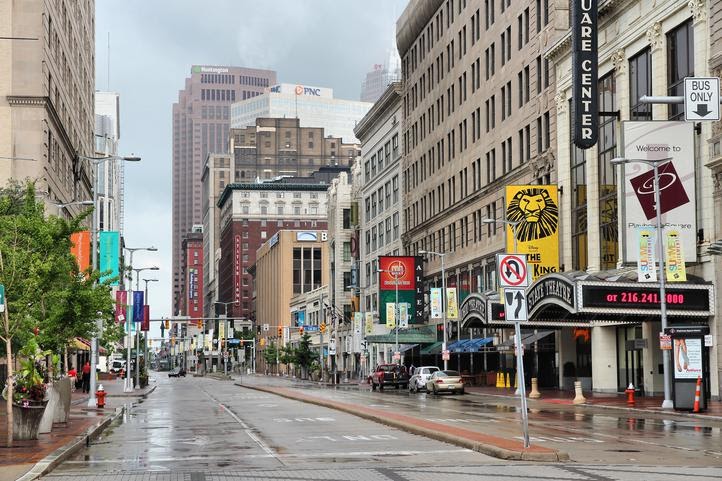
Photo Credit: Alamy Stock Photo
10. Tulsa, Oklahoma
Updated- Motor vehicle theft rate: 809 per 100k people
- Average annual motor vehicle thefts: 3,251
- Overall property theft rate: 5,420 per 100k people
- Violent crime rate: 1,035 per 100k people

Photo Credit: Alamy Stock Photo
9. Kansas City, Missouri
Updated- Motor vehicle theft rate: 836 per 100k people
- Average annual motor vehicle thefts: 4,147
- Overall property theft rate: 4,194 per 100k people
- Violent crime rate: 1,566 per 100k people

Photo Credit: Alamy Stock Photo
8. Tacoma, Washington
Updated- Motor vehicle theft rate: 852 per 100k people
- Average annual motor vehicle thefts: 1,863
- Overall property theft rate: 5,287 per 100k people
- Violent crime rate: 831 per 100k people

Photo Credit: Alamy Stock Photo
7. Anchorage, Alaska
Updated- Motor vehicle theft rate: 864 per 100k people
- Average annual motor vehicle thefts: 2,486
- Overall property theft rate: 4,946 per 100k people
- Violent crime rate: 1,271 per 100k people

Photo Credit: Alamy Stock Photo
6. St. Louis, Missouri
Updated- Motor vehicle theft rate: 938 per 100k people
- Average annual motor vehicle thefts: 2,820
- Overall property theft rate: 6,153 per 100k people
- Violent crime rate: 1,972 per 100k people

Photo Credit: Alamy Stock Photo
5. San Bernardino, California
Updated- Motor vehicle theft rate: 1,007 per 100k people
- Average annual motor vehicle thefts: 2,183
- Overall property theft rate: 4,076 per 100k people
- Violent crime rate: 1,318 per 100k people

Photo Credit: Alamy Stock Photo
4. Portland, Oregon
Updated- Motor vehicle theft rate: 1,040 per 100k people
- Average annual motor vehicle thefts: 6,886
- Overall property theft rate: 5,397 per 100k people
- Violent crime rate: 522 per 100k people
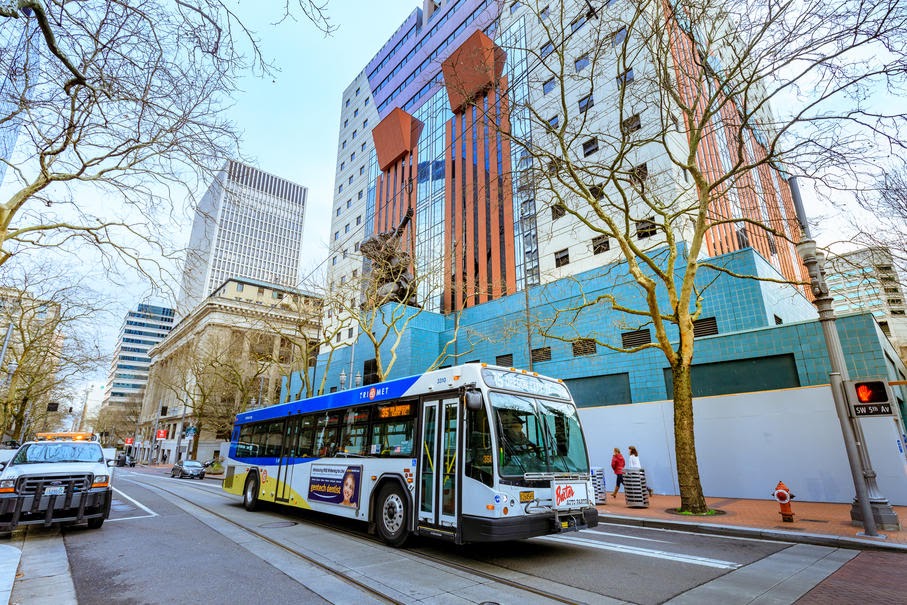
Photo Credit: Alamy Stock Photo
3. Detroit, Michigan
Updated- Motor vehicle theft rate: 1,080 per 100k people
- Average annual motor vehicle thefts: 7,165
- Overall property theft rate: 4,416 per 100k people
- Violent crime rate: 2,025 per 100k people

Photo Credit: Alamy Stock Photo
2. Albuquerque, New Mexico
Updated- Motor vehicle theft rate: 1,170 per 100k people
- Average annual motor vehicle thefts: 6,575
- Overall property theft rate: 4,507 per 100k people
- Violent crime rate: 1,360 per 100k people
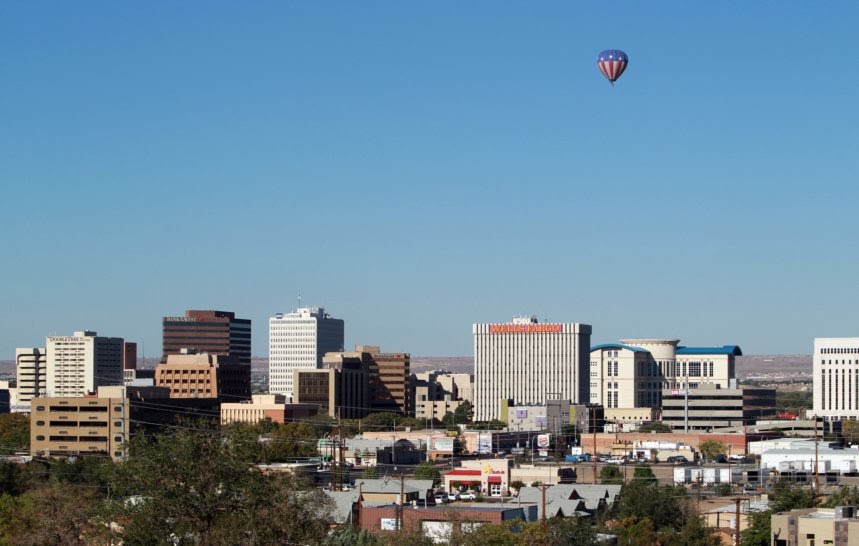
Photo Credit: Alamy Stock Photo
1. Oakland, California
Updated- Motor vehicle theft rate: 1,199 per 100k people
- Average annual motor vehicle thefts: 5,202
- Overall property theft rate: 5,874 per 100k people
- Violent crime rate: 1,269 per 100k people

Photo Credit: Alamy Stock Photo
Detailed findings and methodology
UpdatedThe car theft capitals of the U.S. are spread out across the country. On average, these 25 cities had 827 car thefts per 100,000 people, several times higher than the national rate of 228 per 100,000, and averaged nearly 4,000 cars stolen annually. The cities with the highest car theft rates tend to have high violent crime rates as well, averaging 1,088 violent crimes per 100,000 people. The national violent crime rate is much lower, at 383 violent crimes per 100,000 people.
The COVID-19 pandemic has caused record high unemployment, and while the economic situation has improved since the spring, millions of people remain jobless. High unemployment may lead to higher property crime rates (including car thefts). In this regard, cities with already high levels of car theft might experience further increases this year.
To determine the cities with the highest motor vehicle theft rates, researchers at CoPilot analyzed the latest crime data from the FBI’s Uniform Crime Report. Cities were ranked according to their motor vehicle theft rate per 100,000 people, averaged over the years 2017, 2018, and 2019. Researchers also calculated the average annual number of motor vehicle thefts, the overall property theft rate, and the violent crime rate over the same three-year time period. Only the 150 largest U.S. cities were included in the analysis.

