


Teen drivers are nearly three times more likely to be involved in a fatal crash due to factors such as their lack of experience and their likelihood of engaging in risky behavior like texting and driving.
The states with the most (and least) teens texting and driving
Intro
Updated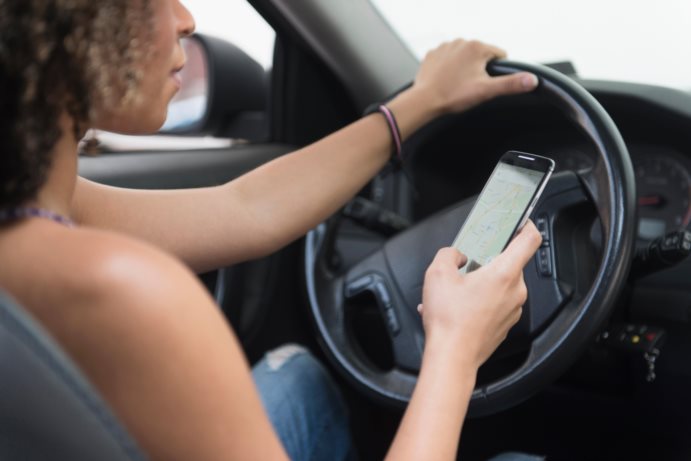 Photo Credit: Alamy Stock Photo
Learning how to drive is a rite of passage for many American teens. However, driving a car comes with immense responsibility as well as a lot of risk. Compared to the rest of the driving population, teen drivers are nearly three times more likely to be involved in a fatal crash due to factors such as their lack of experience and their likelihood of engaging in risky behavior like texting and driving.
According to the Centers for Disease Control and Prevention (CDC), while people ages 15-19 represent just over 6 percent of the population, they accounted for 8.4 percent ($13.6 billion) of total motor vehicle injury costs. Data from the National Highway Traffic Safety Administration (NHTSA) also shows that 16- to 20-year-olds represent 8.3 percent of all traffic fatalities in the U.S.
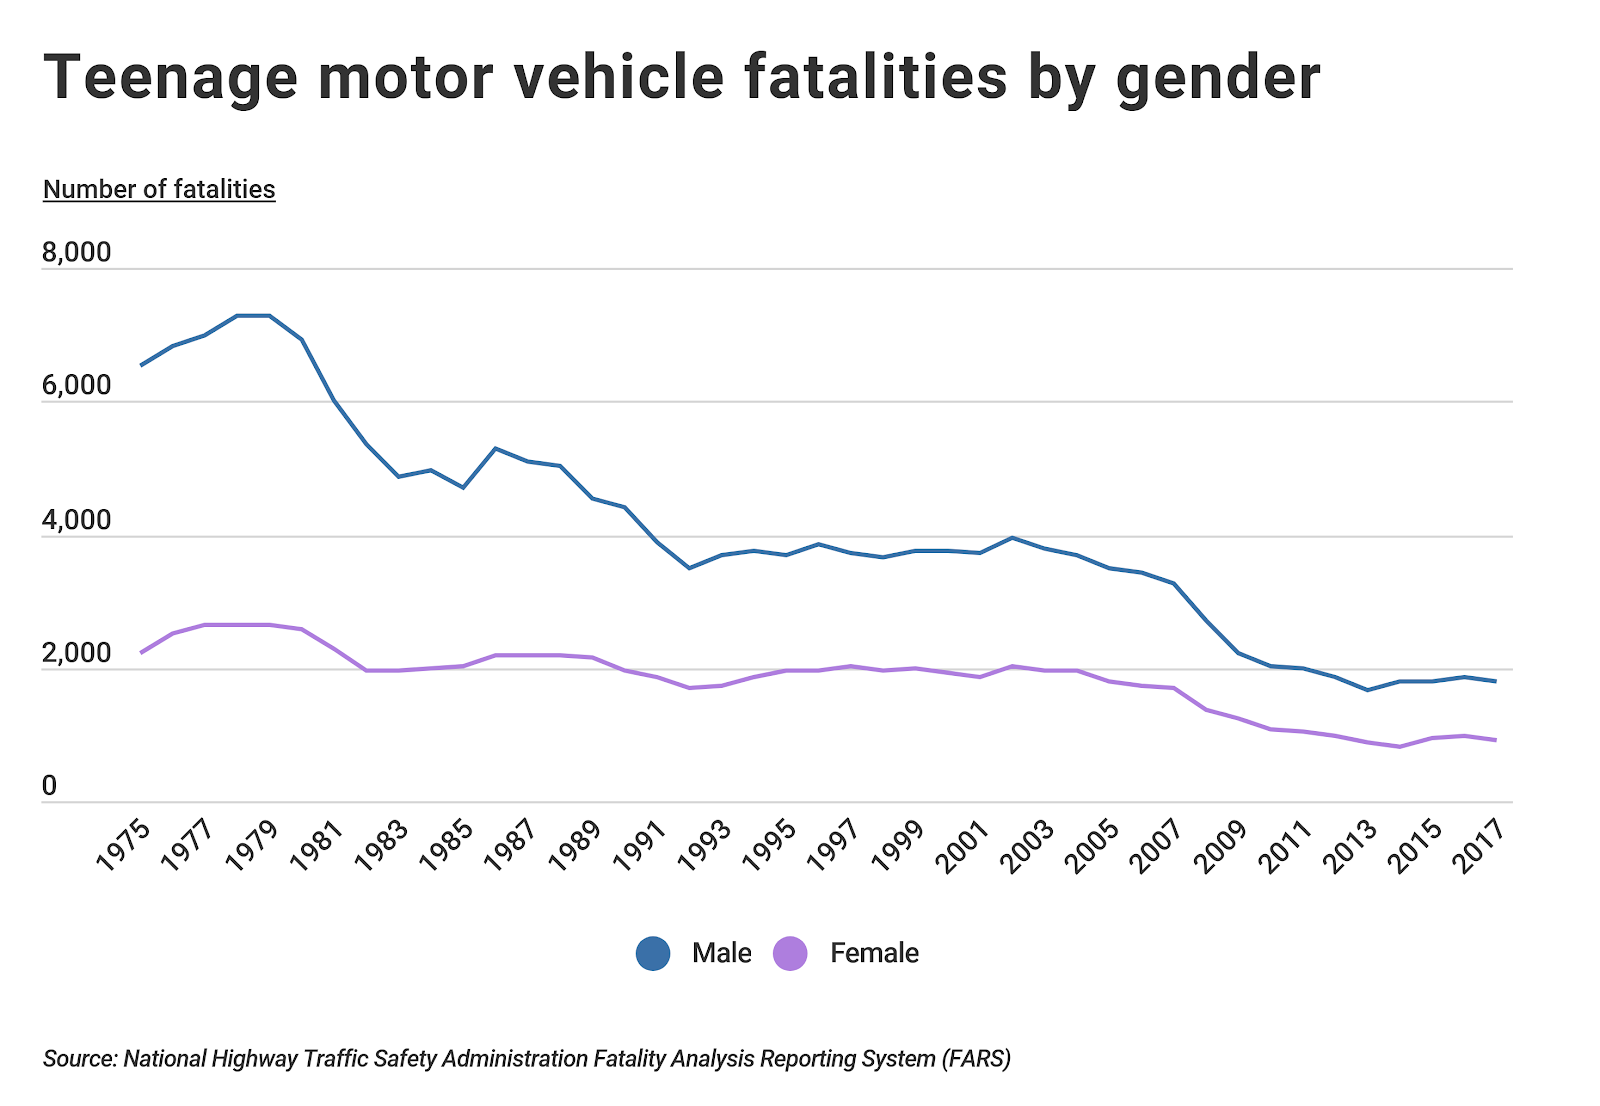
Not all teenagers are equally likely to be involved in a motor vehicle crash. NHTSA data shows that teenage males are almost twice as likely as teenage females to be victims of motor vehicle fatalities. In 2017, 1,807 teenage boys died from motor vehicle crashes, compared to 925 teenage girls. The good news is that teen deaths from motor vehicle crashes is about a third of what it was in 1975, with the sharpest declines occurring among males.
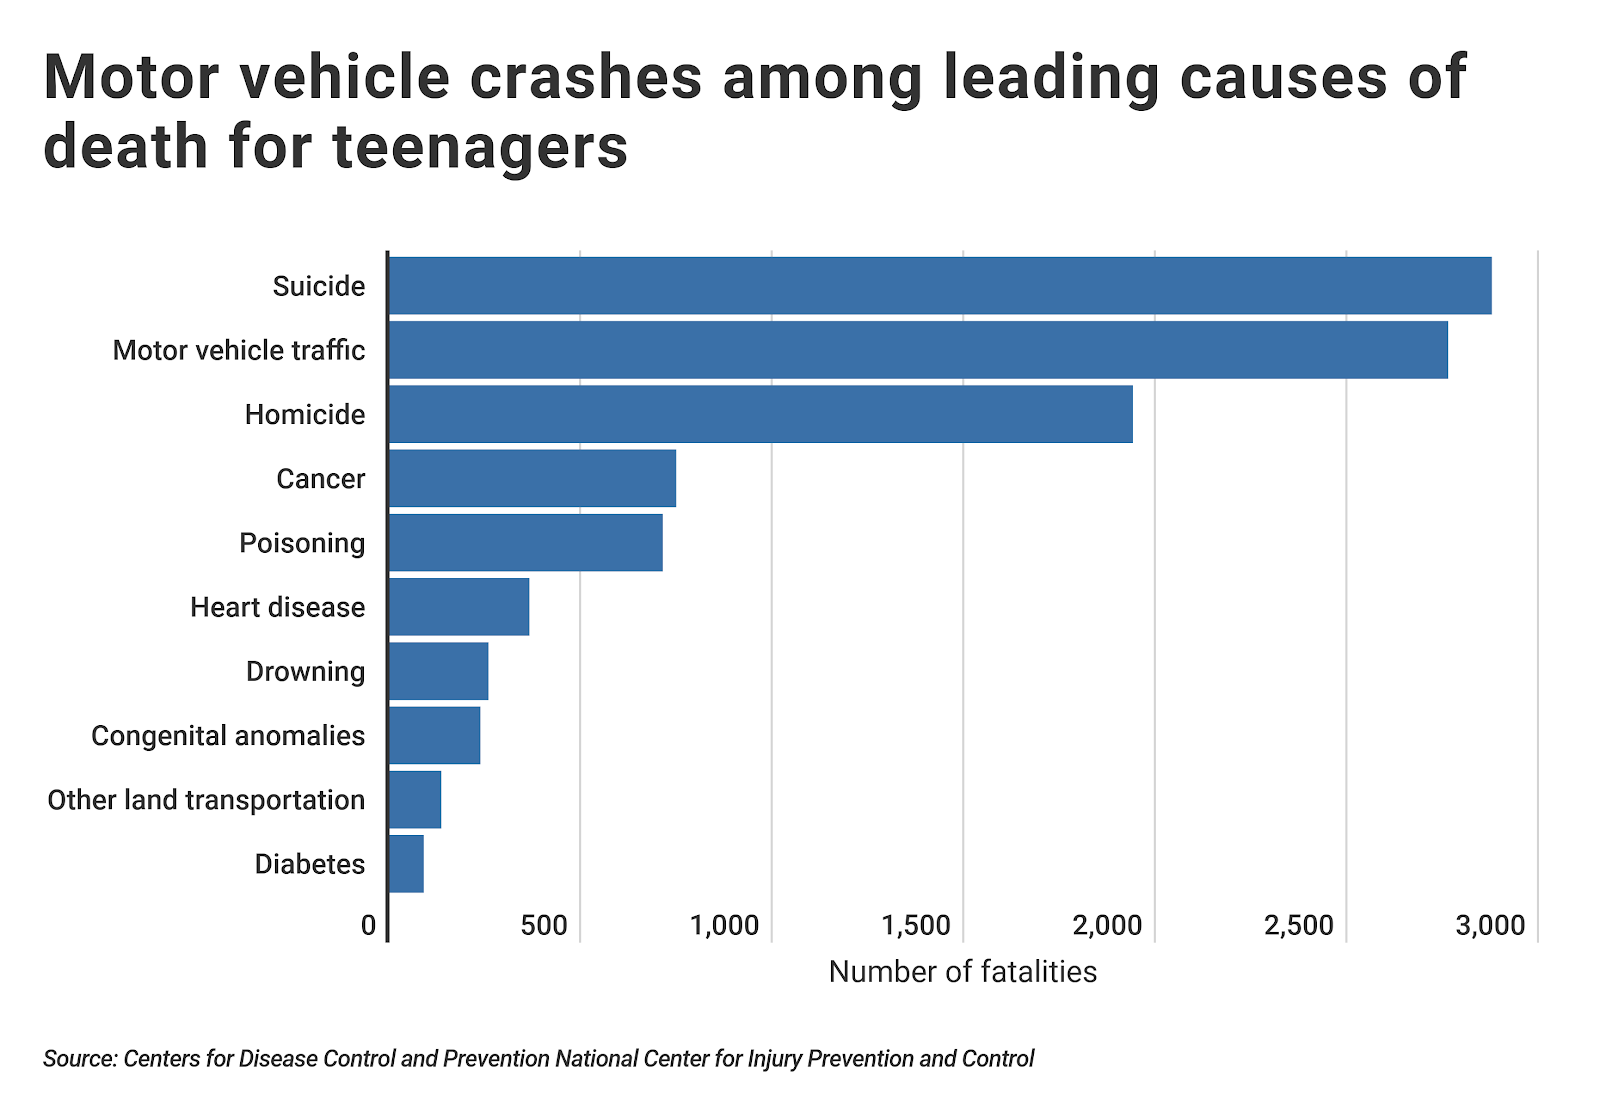
Despite declining fatalities, motor vehicle crashes are still the second leading cause of death among teens. In 2016, 2,763 teens died as a result of motor vehicle accidents. That’s more than the combined total of teens who have died as a result of cancer, poisoning, heart disease, drowning, congenital anomalies, other transportation incidents, and diabetes.
One of the biggest dangers that teenage drivers face is distracted driving, which is defined as engaging in a behavior that takes attention away from the road. The CDC estimates that every day there are nine fatalities and more than 1,000 injuries as a result of distracted driving. A common form of distracted driving—especially among teens—is cell phone use. NHTSA statistics show that in 2017, there were 3,166 fatalities resulting from distracted driving, with 434 of them involving a driver using a cell phone.
According to the CDC, texting behind the wheel is a particularly dangerous form of distracted driving since it involves visual, manual, and cognitive distraction. Sending or reading a text message means that the driver will take his or her eyes off the road for about five seconds, which translates to the distance of a football field when driving at 55 mph.
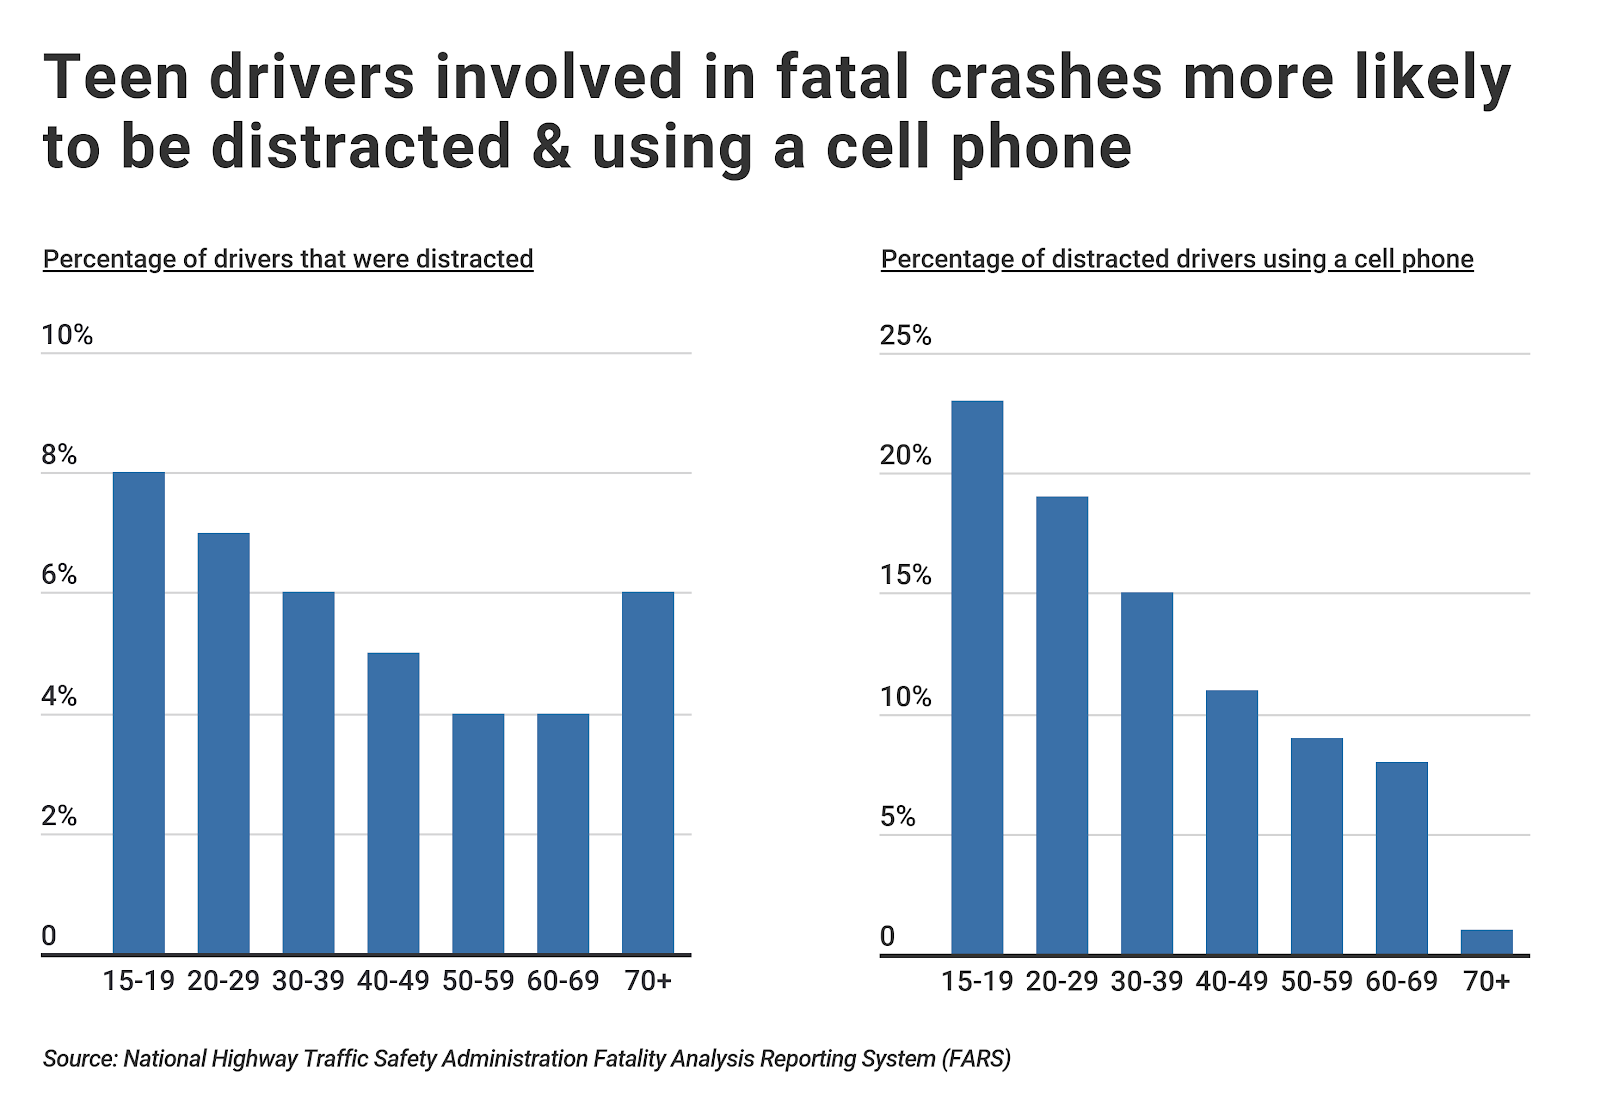
Nationwide, 39.2 percent of teens report texting while driving, according to data from them CDC Youth Behavior Surveillance System (YRBSS). This figure underscores data from the NHTSA showing that teens are more likely to be distracted or using cell phones than more experienced, senior drivers. Specifically, among teen drivers involved in fatal crashes, 8 percent were classified as distracted, compared to 6 percent across all ages. Among these distracted teen drivers involved in fatal crashes, 23 percent were using a cell phone, compared to 13 percent across all ages.
There are several precautions that teenagers can take to reduce distractions and ensure safer driving including:
- Teenage drivers can put their phone out of reach, such as in the glove compartment or in a backpack in the back seat.
- Young drivers can utilize their smartphones’ “Do Not Disturb” or “Driving Mode,” which silences a phone’s notification when it detects that the device is in a moving vehicle.
- Teens should be aware of and always follow their state laws on phone use behind the wheel as well.
Since the 1990s, all 50 states have implemented a graduated driver licensing (GDL) system that gradually grants driving privileges based on a teen’s age and driving experience. For example, 38 states and the District of Columbia ban all cell phone use by novice drivers. The purpose of these GDL laws is to slowly acclimate teens to driving and to improve road safety.
While driving and texting is a nationwide problem, teens in some states are more likely to engage in this behavior than in others. To find which states have the most teens texting while driving, researchers at CarInsurance.org analyzed data from the Centers for Disease Control and Prevention Youth Behavior Surveillance System (YRBSS) to see how many teenagers reported texting or emailing on their phone while driving at least once in the past 30 days.
The states where teenagers are most likely to text and drive are mainly in the Southeast or the Midwest. Interestingly, none of the states with the most teens texting and driving are coastal. Here are the top 10 states where teen drivers don’t put down their phones.
States with the most teens texting and driving
10. Oklahoma
Updated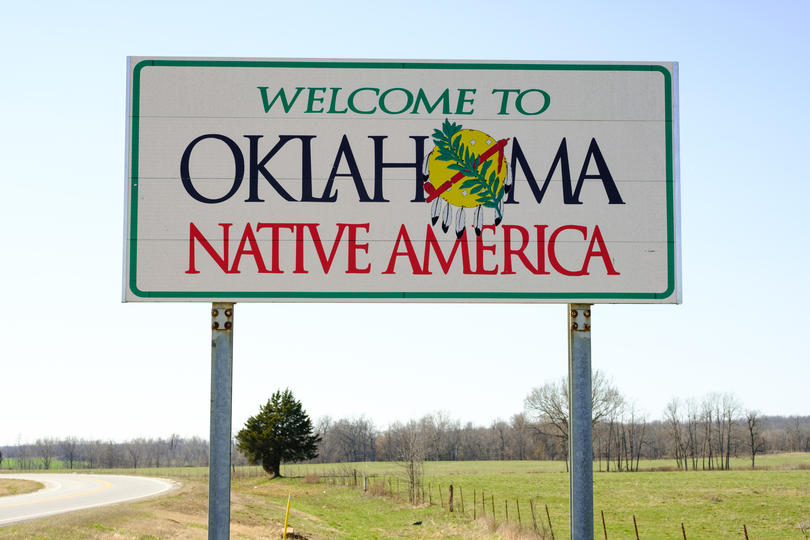
Photo Credit: Alamy Stock Photo
- Percentage of teens who text & drive: 45.7%
- Teen traffic fatalities: 58 (8.9% of all traffic fatalities)
- Distraction-affected traffic fatalities: 60 (9.2% of all traffic fatalities)
- Total traffic fatalities: 655
- Traffic fatality rate (per billion vehicle miles): 13.3
9. Arkansas
Updated
Photo Credit: Alamy Stock Photo
- Percentage of teens who text & drive: 46.2%
- Teen traffic fatalities: 31 (6.3% of all traffic fatalities)
- Distraction-affected traffic fatalities: 9 (1.8% of all traffic fatalities)
- Total traffic fatalities: 493
- Traffic fatality rate (per billion vehicle miles): 13.5
8. Missouri
Updated
Photo Credit: Alamy Stock Photo
- Percentage of teens who text & drive: 46.4%
- Teen traffic fatalities: 93 (10.0% of all traffic fatalities)
- Distraction-affected traffic fatalities: 75 (8.1% of all traffic fatalities)
- Total traffic fatalities: 930
- Traffic fatality rate (per billion vehicle miles): 12.3
7. Idaho
Updated
Photo Credit: Alamy Stock Photo
- Percentage of teens who text & drive: 47.0%
- Teen traffic fatalities: 25 (10.2% of all traffic fatalities)
- Distraction-affected traffic fatalities: 12 (4.9% of all traffic fatalities)
- Total traffic fatalities: 244
- Traffic fatality rate (per billion vehicle miles): 14.1
6. Kansas
Updated
Photo Credit: Alamy Stock Photo
- Percentage of teens who text & drive: 48.0%
- Teen traffic fatalities: 38 (8.2% of all traffic fatalities)
- Distraction-affected traffic fatalities: 103 (22.3% of all traffic fatalities)
- Total traffic fatalities: 461
- Traffic fatality rate (per billion vehicle miles): 14.3
5. Nebraska
Updated
Photo Credit: Alamy Stock Photo
- Percentage of teens who text & drive: 48.3%
- Teen traffic fatalities: 30 (13.2% of all traffic fatalities)
- Distraction-affected traffic fatalities: 20 (8.8% of all traffic fatalities)
- Total traffic fatalities: 228
- Traffic fatality rate (per billion vehicle miles): 10.9
4. Tennessee
Updated
Photo Credit: Alamy Stock Photo
- Percentage of teens who text & drive: 49.0%
- Teen traffic fatalities: 65 (6.3% of all traffic fatalities)
- Distraction-affected traffic fatalities: 40 (3.8% of all traffic fatalities)
- Total traffic fatalities: 1,040
- Traffic fatality rate (per billion vehicle miles): 12.6
3. North Dakota
Updated
Photo Credit: Alamy Stock Photo
- Percentage of teens who text & drive: 52.6%
- Teen traffic fatalities: 10 (8.7% of all traffic fatalities)
- Distraction-affected traffic fatalities: 9 (7.8% of all traffic fatalities)
- Total traffic fatalities: 115
- Traffic fatality rate (per billion vehicle miles): 11.8
2. Montana
Updated
Photo Credit: Alamy Stock Photo
- Percentage of teens who text & drive: 54.2%
- Teen traffic fatalities: 14 (7.5% of all traffic fatalities)
- Distraction-affected traffic fatalities: 10 (5.4% of all traffic fatalities)
- Total traffic fatalities: 186
- Traffic fatality rate (per billion vehicle miles): 14.7
1. Iowa
Updated
Photo Credit: Alamy Stock Photo
- Percentage of teens who text & drive: 55.2%
- Teen traffic fatalities: 41 (12.4% of all traffic fatalities)
- Distraction-affected traffic fatalities: 27 (8.2% of all traffic fatalities)
- Total traffic fatalities: 330
- Traffic fatality rate (per billion vehicle miles): 9.9
States with the fewest teens texting and driving
10. Florida
Updated
Photo Credit: Alamy Stock Photo
- Percentage of teens who text & drive: 35.1%
- Teen traffic fatalities: 205 (6.6% of all traffic fatalities)
- Distraction-affected traffic fatalities: 218 (7.0% of all traffic fatalities)
- Total traffic fatalities: 3,112
- Traffic fatality rate (per billion vehicle miles): 14.2
9. Kentucky
Updated
Photo Credit: Alamy Stock Photo
- Percentage of teens who text & drive: 34.7%
- Teen traffic fatalities: 59 (7.5% of all traffic fatalities)
- Distraction-affected traffic fatalities: 146 (18.7% of all traffic fatalities)
- Total traffic fatalities: 782
- Traffic fatality rate (per billion vehicle miles): 15.9
8. California
Updated
Photo Credit: Alamy Stock Photo
- Percentage of teens who text & drive: 34.3%
- Teen traffic fatalities: 215 (6.0% of all traffic fatalities)
- Distraction-affected traffic fatalities: 146 (4.1% of all traffic fatalities)
- Total traffic fatalities: 3,602
- Traffic fatality rate (per billion vehicle miles): 10.5
7. Vermont
Updated
Photo Credit: Alamy Stock Photo
- Percentage of teens who text & drive: 34.1%
- Teen traffic fatalities: 3 (4.3% of all traffic fatalities)
- Distraction-affected traffic fatalities: 7 (10.1% of all traffic fatalities)
- Total traffic fatalities: 69
- Traffic fatality rate (per billion vehicle miles): 9.3
6. West Virginia
Updated
Photo Credit: Alamy Stock Photo
- Percentage of teens who text & drive: 34.0%
- Teen traffic fatalities: 27 (8.9% of all traffic fatalities)
- Distraction-affected traffic fatalities: 39 (12.9% of all traffic fatalities)
- Total traffic fatalities: 303
- Traffic fatality rate (per billion vehicle miles): 15.9
5. Connecticut
Updated
Photo Credit: Alamy Stock Photo
- Percentage of teens who text & drive: 33.0%
- Teen traffic fatalities: 13 (4.7% of all traffic fatalities)
- Distraction-affected traffic fatalities: 12 (4.3% of all traffic fatalities)
- Total traffic fatalities: 278
- Traffic fatality rate (per billion vehicle miles): 8.8
4. Nevada
Updated
Photo Credit: Alamy Stock Photo
- Percentage of teens who text & drive: 31.9%
- Teen traffic fatalities: 21 (6.8% of all traffic fatalities)
- Distraction-affected traffic fatalities: 13 (4.2% of all traffic fatalities)
- Total traffic fatalities: 309
- Traffic fatality rate (per billion vehicle miles): 11.2
3. Alaska
Updated
Photo Credit: Alamy Stock Photo
- Percentage of teens who text & drive: 28.6%
- Teen traffic fatalities: 2 (2.5% of all traffic fatalities)
- Distraction-affected traffic fatalities: 3 (3.8% of all traffic fatalities)
- Total traffic fatalities: 79
- Traffic fatality rate (per billion vehicle miles): 14.3
2. Maryland
Updated
Photo Credit: Alamy Stock Photo
- Percentage of teens who text & drive: 28.1%
- Teen traffic fatalities: 41 (7.5% of all traffic fatalities)
- Distraction-affected traffic fatalities: 45 (8.2% of all traffic fatalities)
- Total traffic fatalities: 550
- Traffic fatality rate (per billion vehicle miles): 9.2
1. New York
Updated
Photo Credit: Alamy Stock Photo
- Percentage of teens who text & drive: 27.4%
- Teen traffic fatalities: 73 (7.3% of all traffic fatalities)
- Distraction-affected traffic fatalities: 143 (14.3% of all traffic fatalities)
- Total traffic fatalities: 999
- Traffic fatality rate (per billion vehicle miles): 8.1
Methodology
UpdatedData on teen texting and driving is from the Centers for Disease Control and Prevention Youth Behavior Surveillance System (YRBSS). The YRBSS is a school-based survey conducted every two years on representative samples of public and private high school students. For this analysis, the percentage of teen drivers who text & drive corresponds to those who report texting or emailing while driving at least once in the past 30 days (among students who had driven during the past 30 days).
Data on annual traffic fatalities and crashes is from the National Highway Traffic Safety Administration Fatality Analysis Reporting System (FARS). Distraction-affected crashes are those in which an involved driver was distracted by one or multiple factors, including but not limited to: using a cellular phone, adjusting audio/climate controls, daydreaming, eating or drinking, interacting with another occupant in the vehicle, or looking at something outside of the vehicle. All data is for 2017, which is the most recent available year.
States were ordered by the percentage of teen drivers who text and drive. Only states with available data from the CDC were included in the analysis. For a complete list of results for all available states, view the original version on CarInsurance.org.

