


Tucson school districts could lose more than $30 million in state funding if state lawmakers don’t change the law that funds online learning at a lower rate than in-person instruction.
Statewide, public schools doing remote learning at the direction of health officials are projected to lose up to $266 million because Arizona law funds distance learning at 5% less than in-person school, and they’re losing another $200 million because of enrollment declines. At the same time, the state has billions of dollars in surplus and savings.
“When the state sits on a billion-dollar rainy-day fund and projects a $2 billion surplus, there is no excuse to not fully fund every school,” said Arizona schools chief Kathy Hoffman during her State of Education address on Feb. 2. “There has never been a more urgent time to tap into a safety net and provide for Arizonans. Anyone who thinks it’s not raining in Arizona right now needs to check their privilege.”
When schools closed last March, state lawmakers voted to fully fund remote learning for the rest of that school year.
Arizona’s recently released Senate Republican budget framework proposes a temporary, one-year policy change to fund distance learners at 100% for the current school year. Senate President Karen Fann says the measure seems to have good support.
It will be several weeks, at least, until a decision is made. And meanwhile school officials are holding their breaths, hoping they’ll get enough funding to sustain themselves without making cuts.
While two federal relief packages are delivering schools one-time fiscal support, many public schools will not be able to stretch federal relief dollars to cover long existing gaps in their budgets on top of pandemic-related expenses and enrollment declines, Hoffman said.
“Without predictable, ongoing state funding, many public schools, particularly small schools, will not be able to sustain their operations and provide a full range of services to students and families in their communities,” she said.
It’s hard for school districts to plan how to spend their money when they don’t know how much they’ll have, says Scott Little, chief financial officer for the Amphitheater School District, which serves nearly 11,000 children, 37% of whom qualify for free and reduced lunch — a measure of poverty — though that number is likely higher due to parents not applying during the pandemic.
“If the Legislature drags this issue out until May, all it does is make it harder and harder for us,” Little said.
Amphitheater, which opened for limited in-person classes before returning to remote learning under Pima County Health Department guidance as COVID-19 numbers spiked in December, stands to lose more than $3.1 million if remote learning is not fully funded.
The number of students in Tucson school districts who are remote learning is changing as some resume in-person learning. But based on Arizona Department of Education calculations, about 135,000, or 95% of students, were remote at the beginning of January.
ENROLLMENT LOSSES COMPOUND SHORTFALL
Gov. Doug Ducey created grants for schools using funding from the first federal coronavirus relief package. The $370 million in Enrollment Stability Grants was meant to compensate schools for both enrollment losses and to fill the gap for remote learners being funded at a lower rate.
But those grants fell more than $250 million short of what schools were promised, in part, because of huge enrollment losses in public schools.
On top of that, the state put a $500 cap on each student lost. As a result, districts that saw the steepest enrollment declines received the least amount of money proportionally to cover those losses.
Tucson’s nine major school districts fell more than $18 million short of what they were told to expect from the grant funds, a number that increases if you include the county’s seven smaller school districts and 87 charter schools.
Preliminary enrollment data shows the average number of students enrolled in public schools daily throughout the state fell more than 33,000 short of this time last year, according to data from the Department of Education. This difference can be accounted for by kids switching to home schools, private schools, holding off on kindergarten a year and even stopping school entirely.

Public schools doing remote learning across the state are projected to lose up to $266 million because Arizona law funds distance learning at 5% less than in-person school.
Preliminary data also shows a shift of families choosing charter schools over traditional school districts, which serve a larger body of students and students in need. Average daily membership in school districts was about 47,900 lower and about 14,700 higher in charter schools, some of which opened for in-person learning sooner than the state advised. Those numbers are not finalized and could change before official enrollment data is released in mid-March.
Collectively, Tucson’s nine major school districts saw a loss of about 6,650 students on the 100th day of the school year, an important day in calculating funding for the year.
While enrollment declines in many school districts are not new, the problem is now so much greater, says school finance expert Chuck Essigs, with the Arizona Association of School Business Officials.
If you’re a district and you lose a student, you lose the revenue for that student although the cost doesn’t go down, Essigs says. Schools still need to pay for teachers, utilities, transportation and more.
“You can’t go to the teacher and say, ‘We’re going to pay you 5% less because we’re getting 5% less,’” he said. “The teacher is going to get the same salary; the benefits for that teacher are the same, the insurance. What really makes this hurtful for schools is they’re having funding reduced for expenses that aren’t reduced, and in fact it’s costing them more with all the expense of the technology and equipment they’ve had to buy.”
And even if a district lost enough kids this year to close a school, many are hoping that the students will return once the current crisis is over.
“Districts aren’t getting what they were told they would get to address these very severe problems,” Essigs says.
For example, while Amphitheater received $5.6 million in grants to cover enrollment losses, if they were compensated the way the governor had originally laid out, they would have received nearly $10.5 million, according to calculations by the Arizona Department of Education.
“A lot of people made decisions on what to do for staffing based upon that grant, and the grant money didn’t really materialize the way it was supposed to,” says Little, with the Amphitheater School District. “And everyone’s kind of holding the bag for it.”
Schools are expecting a second wave of federal relief dollars, which Little says will cover some of the Amphitheater’s steepest losses. But, sharing Hoffman’s sentiment, he says that money was meant for relief from steep costs associated with the pandemic and remote learning.
“That’s money that’s not available for us to do additional services to get kids caught up,” he said. “We really want to use that money to do additional remediation work, additional summer stuff, things to get kids back on track. If we can’t use that money for that, it just goes to cover the state.”

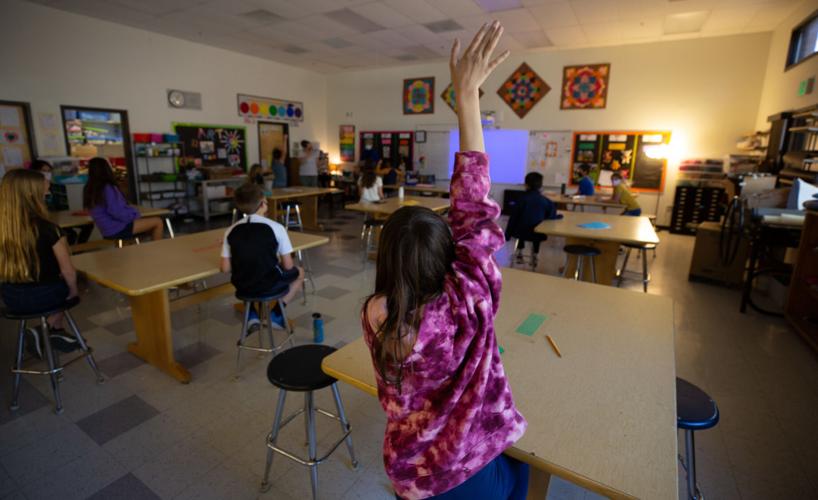
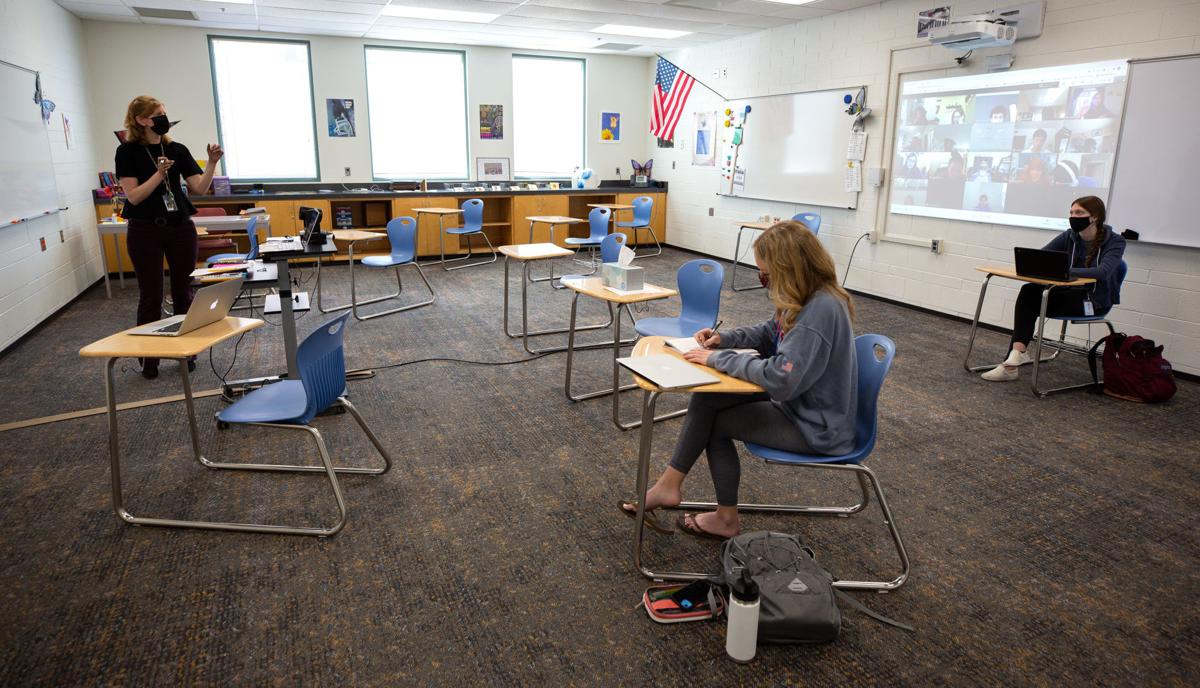
An art class at Sunrise Drive Elementary School in the Catalina Foothills School District, Tucson, on Feb. 4, 2021.
“A NEW LOW”
Sunnyside, Tucson’s second largest school district, planned for an enrollment decline of about 600 students, which they say is largely due to an aging population rather than COVID-19. But it didn’t plan for the state funding remote learners at a lower rate, and it’s put the district in a situation where it could end next school year with close to no savings.
“So this is what we found ourselves in, is additional resources the federal government provided is being taken away by the state, and we’re at net zero,” Chief Financial Officer Hector Encinas said at a Jan. 26 board meeting.
Sunnyside stands to lose as much as $4.2 million in state aid with the reduction for remote learners, according to calculations by the Arizona Department of Education.
To put that into perspective, that could pay for the salaries of 80 first-year teachers, a year’s worth of utilities, 3½ years of liability insurance premiums or 120 additional custodians.
While Sunnyside was able to cover this shortfall with the one-time federal dollars, despite the governor’s grants being about $1.8 million less than expected, it put the district in a position where that budget loss will have to be carried forward to cover next year’s expenditures. While the district typically ends the year with a budget balance of between $2.5 million to about $5 million, next year it is projecting a budget balance of only $169,000.
“For fall next year, the projection basically is that we’re gonna wipe out our savings,” Encinas said. “At this point in time, hopefully, this is the worst-case scenario.”
TUSD, the city’s largest school district with about 40,000 students, stands to lose more than $11.9 million because of remote learners being funded at a lower rate, and the district received about $6.2 million less than expected in grants.
Unlike the rest of Tucson’s major school districts, Tucson Unified has remained entirely remote since the pandemic began with no firm date for students returning to the classroom even part time.
Even schools offering in-person learning stand to lose millions because most are still offering remote learning for the many parents who don’t feel safe sending their children into classrooms while the virus continues at near-peak levels.
Catalina Foothills, the only Tucson school district that didn’t return to remote learning after the winter break, stands to lose as much as $314,000 if remote learning is not fully funded, according to Department of Education calculations.
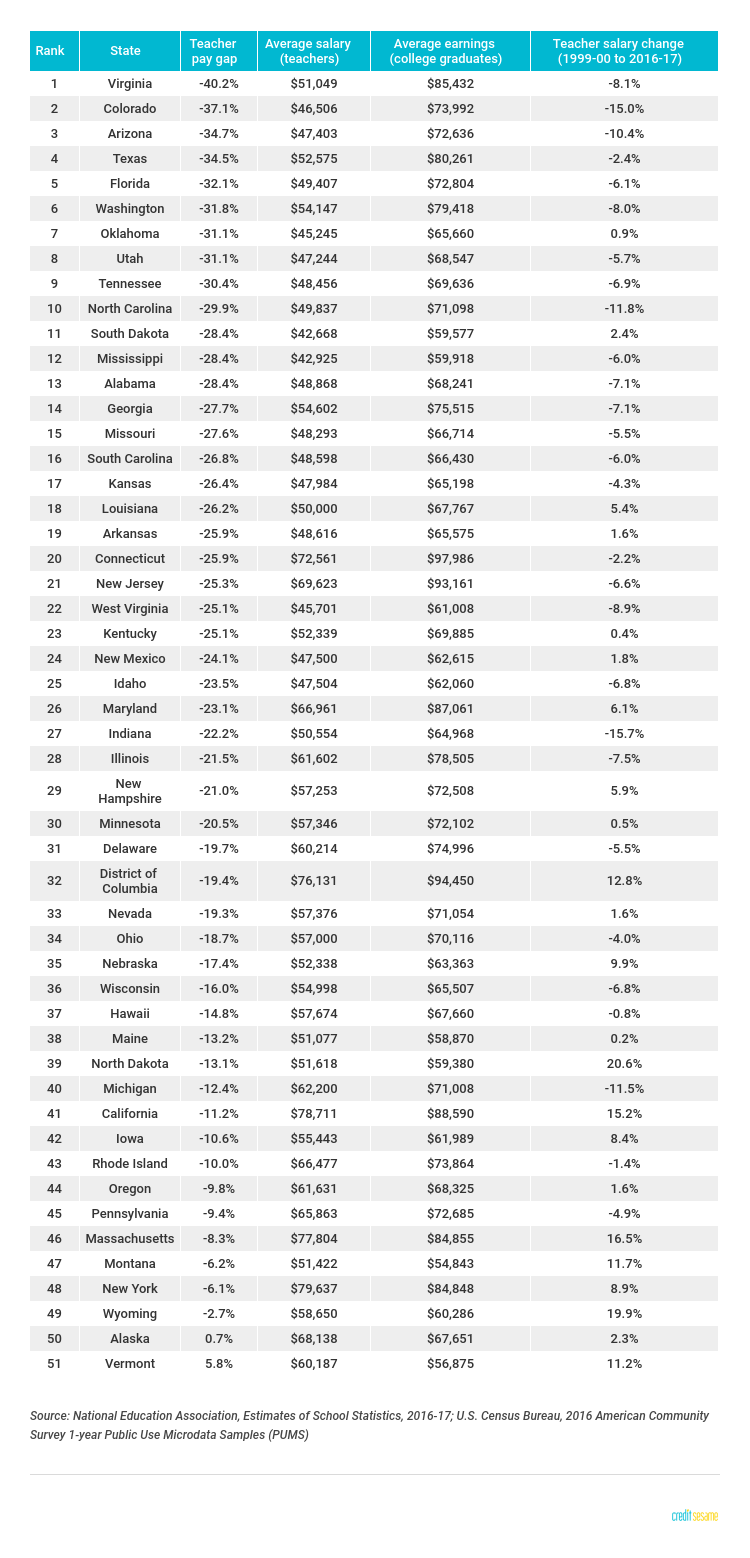
The 25 states with the largest teacher pay gap
Intro
Updated
In recent months, teachers in multiple states, including West Virginia, Kentucky, Arizona, and Colorado, have gone on strike to protest low wages and insufficient resources in public schools. With many states cutting school funding, teachers are experiencing economic pressure inside and outside of the classroom and are voicing their need for change.
According to the National Center for Education Statistics, the average annual salary of teachers in U.S. public elementary and secondary schools is $58,950. Although teachers’ salaries have risen nominally over the past 50 years, when analyzed in “constant dollars” based on the consumer price index, salaries have actually been decreasing since 2009. For comparison, the average annual earnings for workers over the age of 18 who hold a bachelor’s degree or higher in the U.S. is $77,526, resulting in a national teacher pay gap of -24%.
With this in mind, Credit Sesame wanted to see how the pay gap varied from state to state. Its researchers calculated the Teacher pay gap as the percent difference between the Average annual salary for teachers in each state (taken from the National Education Association, Estimates of School Statistics, 2016-17) and the Average annual earnings for all college graduates (calculated for each state using the U.S. Census Bureau, 2016 American Community Survey 1-year Public Use Microdata Samples). Then each state and the District of Columbia was ranked from the highest teacher pay gap to the lowest.
Based on the analysis, the teacher pay gap is in the teachers’ favor in only two states: Vermont and Alaska. The states with the highest teacher salaries are in the populous, heavily urban states of New York, California, Massachusetts, District of Columbia, and Connecticut, while the states with the lowest teacher salaries are in the mostly rural states of Colorado, West Virginia, Oklahoma, Mississippi, and South Dakota. States with lowest teacher salaries also tended to have higher teacher pay gaps. Here are the states with the largest teacher pay gap.
—Credit Sesame
25. Idaho
Updated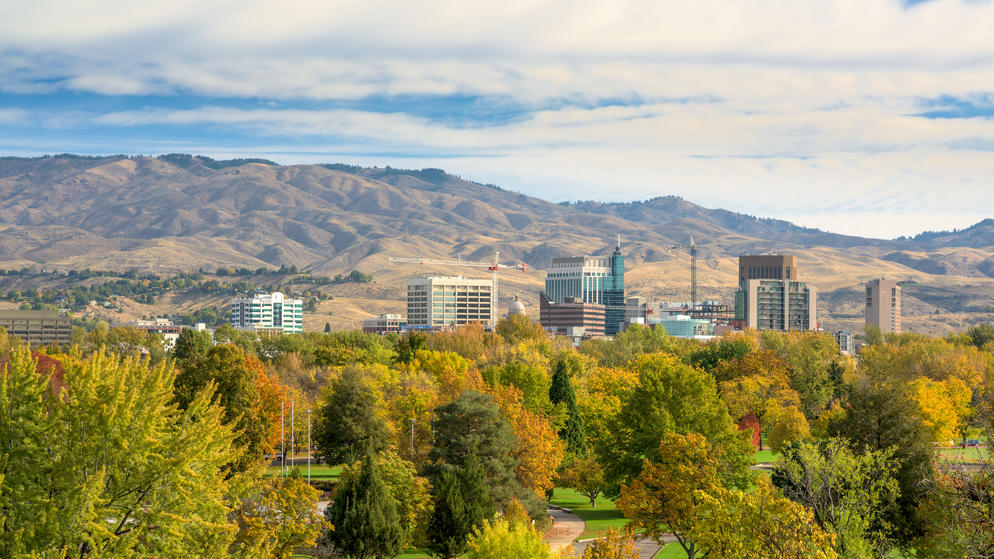
Photo Credit: Charles Knowles / Alamy Stock Photo
- Teacher pay gap: -23.5%
- Average annual salary for teachers: $47,504
- Average annual earnings for all college graduates: $62,060
- Teacher salary change 1999-00 to 2016-17: -6.8%
24. New Mexico
Updated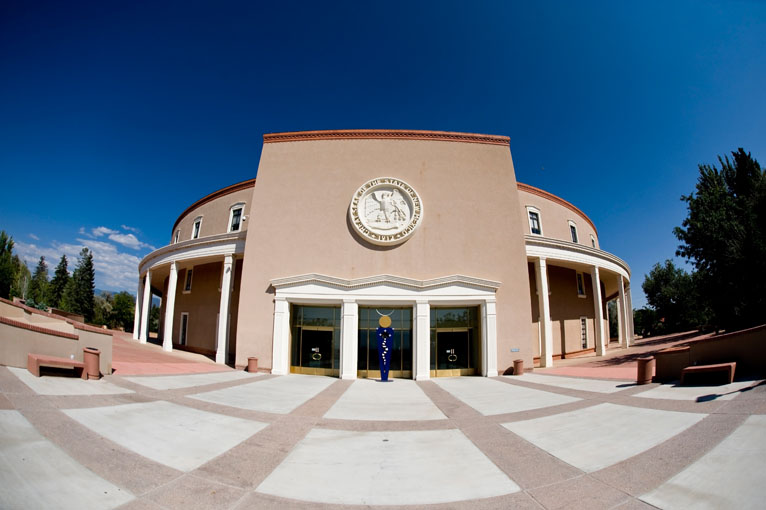
Photo Credit: William Scott / Alamy Stock Photo
- Teacher pay gap: -24.1%
- Average annual salary for teachers: $47,500
- Average annual earnings for all college graduates: $62,615
- Teacher salary change 1999-00 to 2016-17: 1.8%
23. Kentucky
Updated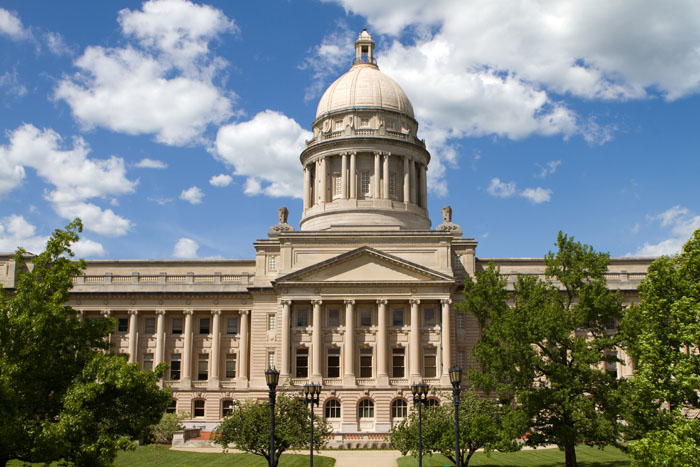
Photo Credit: Steven Frame / Alamy Stock Photo
- Teacher pay gap: -25.1%
- Average annual salary for teachers: $52,339
- Average annual earnings for all college graduates: $69,885
- Teacher salary change 1999-00 to 2016-17: 0.4%
22. West Virginia
Updated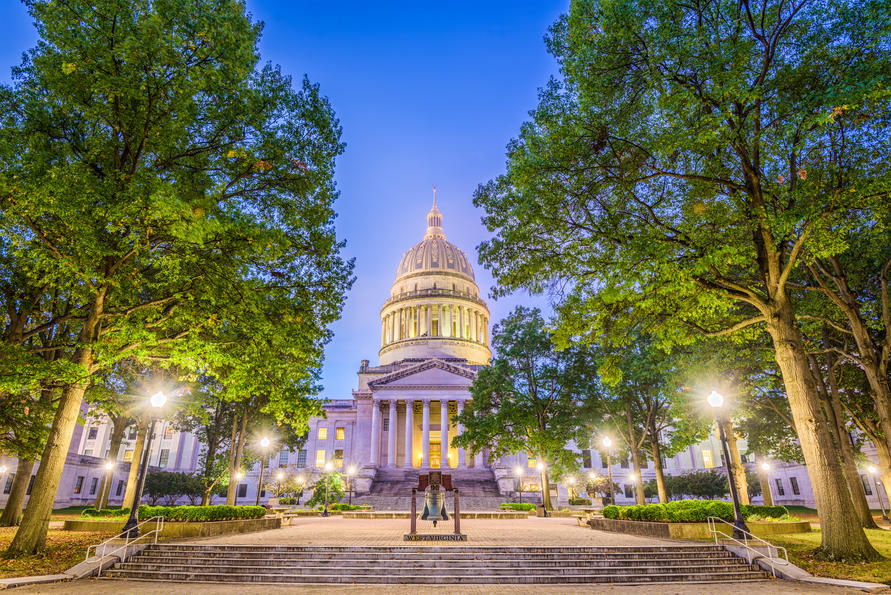
Photo Credit: Sean Pavone / Alamy Stock Photo
- Teacher pay gap: -25.1%
- Average annual salary for teachers: $45,701
- Average annual earnings for all college graduates: $61,008
- Teacher salary change 1999-00 to 2016-17: -8.9%
21. New Jersey
Updated
Photo Credit: Tetra Images / Alamy Stock Photo
- Teacher pay gap: -25.3%
- Average annual salary for teachers: $69,623
- Average annual earnings for all college graduates: $93,161
- Teacher salary change 1999-00 to 2016-17: -6.6%
20. Connecticut
Updated
Photo Credit: Enigma / Alamy Stock Photo
- Teacher pay gap: -25.9%
- Average annual salary for teachers: $72,561
- Average annual earnings for all college graduates: $97,986
- Teacher salary change 1999-00 to 2016-17: -2.2%
19. Arkansas
Updated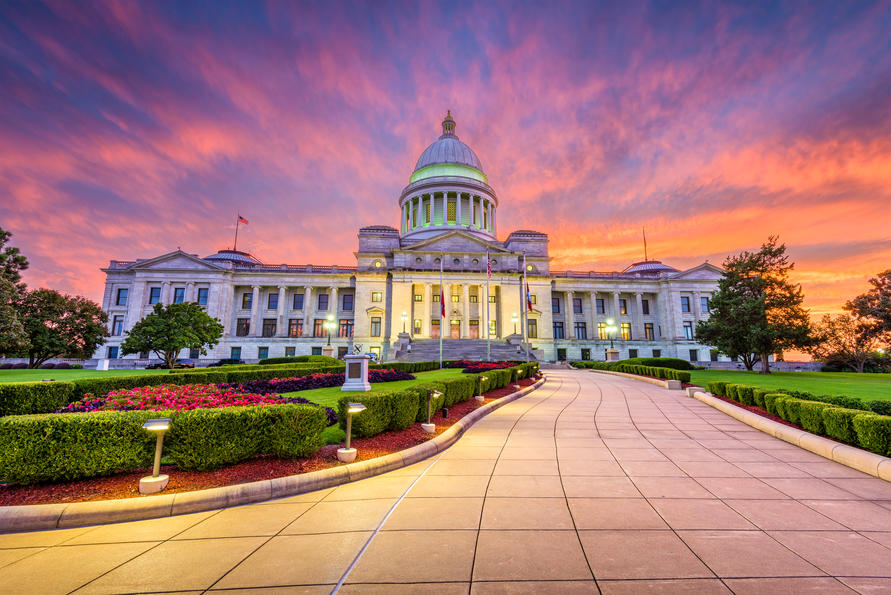
Photo Credit: Sean Pavone / Alamy Stock Photo
- Teacher pay gap: -25.9%
- Average annual salary for teachers: $48,616
- Average annual earnings for all college graduates: $65,575
- Teacher salary change 1999-00 to 2016-17: 1.6%
18. Louisiana
Updated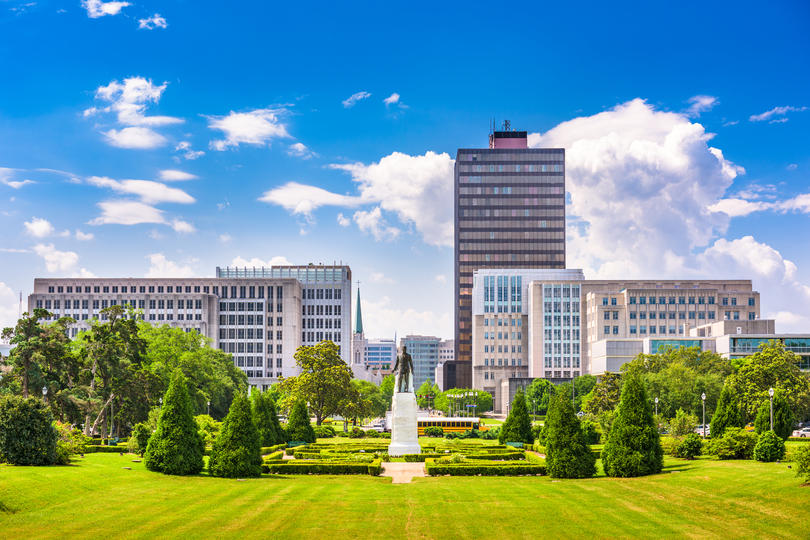
Photo Credit: Sean Pavone / Alamy Stock Photo
- Teacher pay gap: -26.2%
- Average annual salary for teachers: $50,000
- Average annual earnings for all college graduates: $67,767
- Teacher salary change 1999-00 to 2016-17: 5.4%
17. Kansas
Updated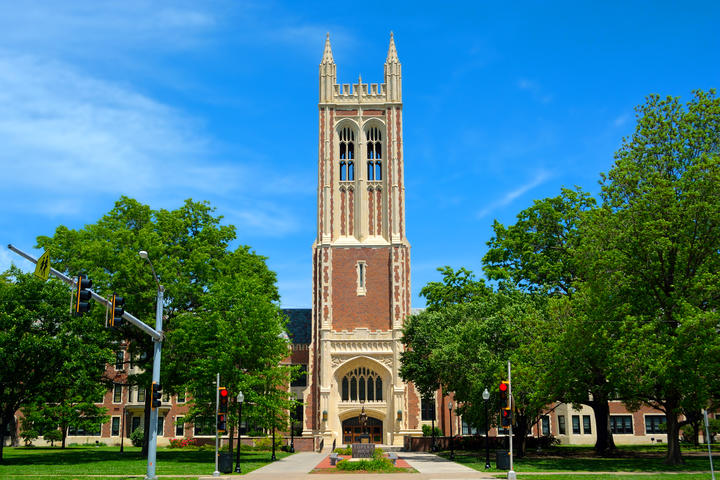
Photo Credit: Jeff Zehnder / Alamy Stock Photo
- Teacher pay gap: -26.4%
- Average annual salary for teachers: $47,984
- Average annual earnings for all college graduates: $65,198
- Teacher salary change 1999-00 to 2016-17: -4.3%
16. South Carolina
Updated
Photo Credit: Sean Pavone / Alamy Stock Photo
- Teacher pay gap: -26.8%
- Average annual salary for teachers: $48,598
- Average annual earnings for all college graduates: $66,430
- Teacher salary change 1999-00 to 2016-17: -6.0%
15. Missouri
Updated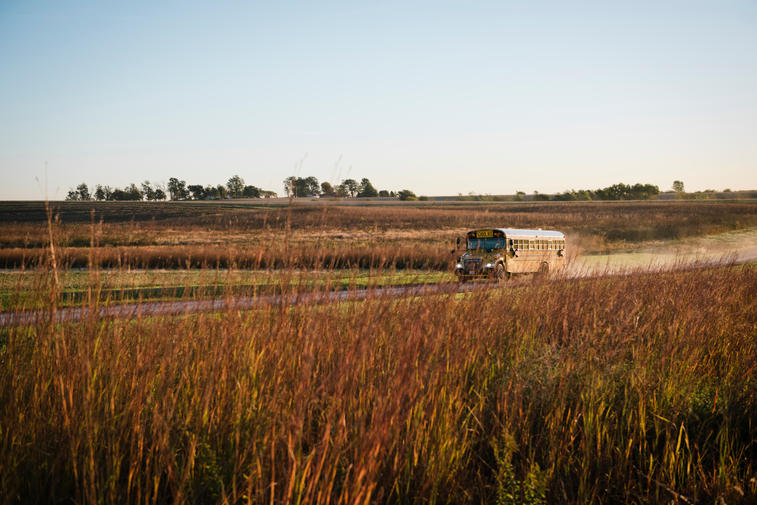
Photo Credit: Image Source / Alamy Stock Photo
- Teacher pay gap: -27.6%
- Average annual salary for teachers: $48,293
- Average annual earnings for all college graduates: $66,714
- Teacher salary change 1999-00 to 2016-17: -5.5%
14. Georgia
Updated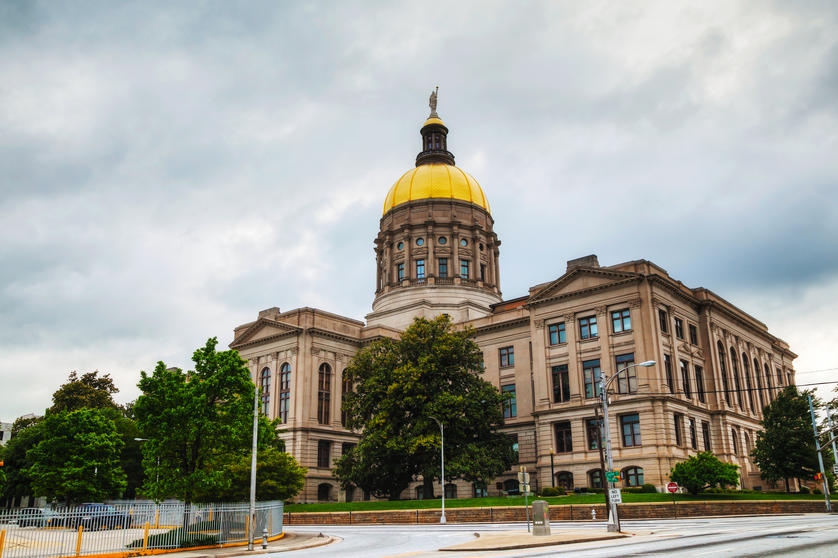
Photo Credit: Zoonar GmbH / Alamy Stock Photo
- Teacher pay gap: -27.7%
- Average annual salary for teachers: $54,602
- Average annual earnings for all college graduates: $75,515
- Teacher salary change 1999-00 to 2016-17: -7.1%
13. Alabama
Updated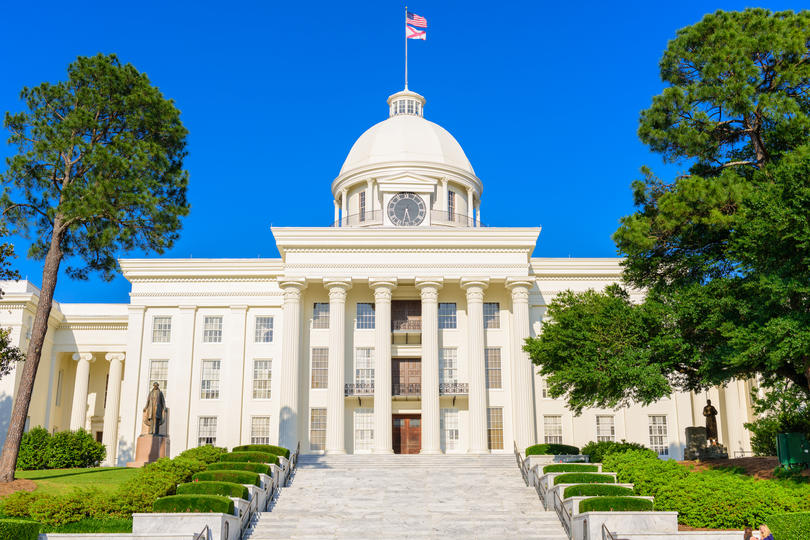
Photo Credit: Sean Pavone / Alamy Stock Photo
- Teacher pay gap: -28.4%
- Average annual salary for teachers: $48,868
- Average annual earnings for all college graduates: $68,241
- Teacher salary change 1999-00 to 2016-17: -7.1%
12. Mississippi
Updated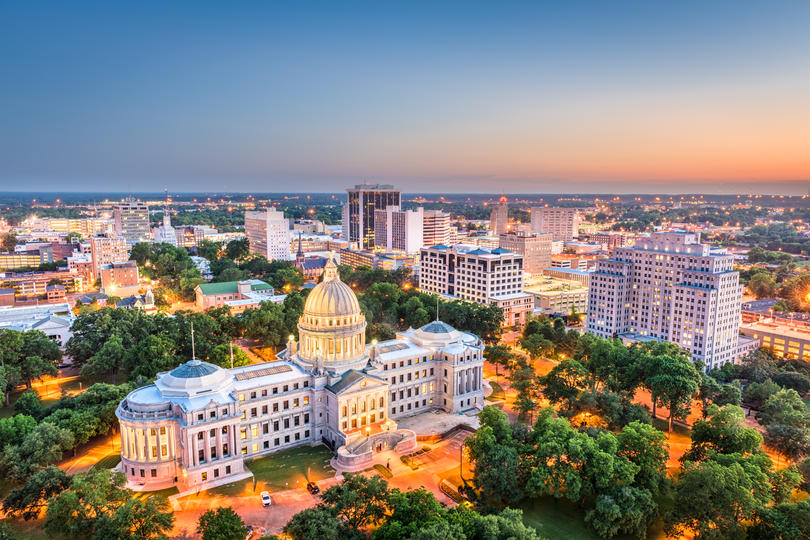
Photo Credit: Sean Pavone / Alamy Stock Photo
- Teacher pay gap: -28.4%
- Average annual salary for teachers: $42,925
- Average annual earnings for all college graduates: $59,918
- Teacher salary change 1999-00 to 2016-17: -6.0%
11. South Dakota
Updated
Photo Credit: Tom Grundy / Alamy Stock Photo
- Teacher pay gap: -28.4%
- Average annual salary for teachers: $42,668
- Average annual earnings for all college graduates: $59,577
- Teacher salary change 1999-00 to 2016-17: 2.4%
10. North Carolina
Updated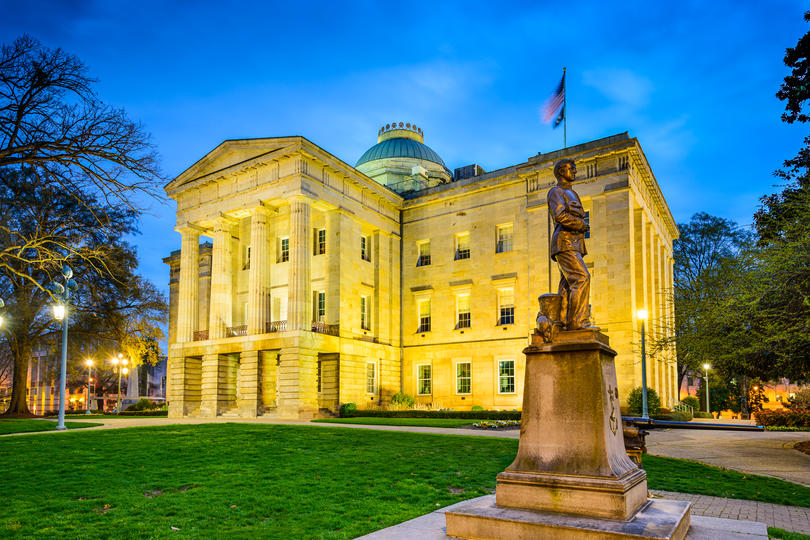
Photo Credit: Sean Pavone / Alamy Stock Photo
- Teacher pay gap: -29.9%
- Average annual salary for teachers: $49,837
- Average annual earnings for all college graduates: $71,098
- Teacher salary change 1999-00 to 2016-17: -11.8%
9. Tennessee
Updated
Photo Credit: Sean Pavone / Alamy Stock Photo
- Teacher pay gap: -30.4%
- Average annual salary for teachers: $48,456
- Average annual earnings for all college graduates: $69,636
- Teacher salary change 1999-00 to 2016-17: -6.9%
8. Utah
Updated
Photo Credit: age fotostock / Alamy Stock Photo
- Teacher pay gap: -31.1%
- Average annual salary for teachers: $47,244
- Average annual earnings for all college graduates: $68,547
- Teacher salary change 1999-00 to 2016-17: -5.7%
7. Oklahoma
Updated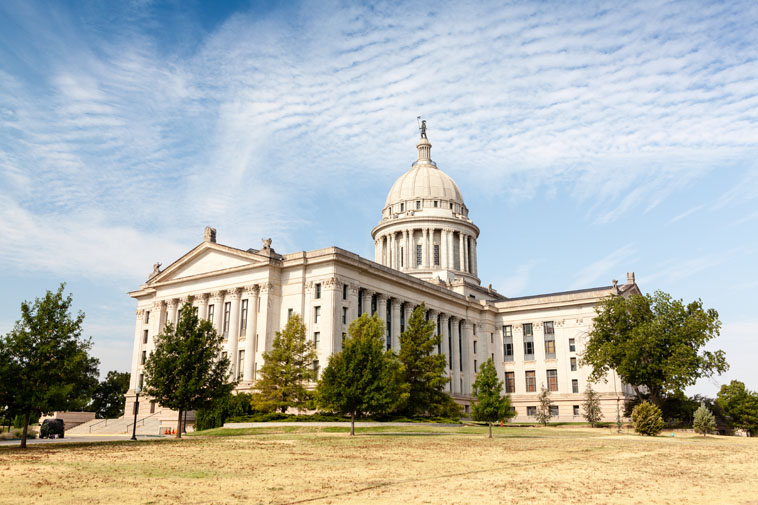
Photo Credit: Dave Newman / Alamy Stock Photo
- Teacher pay gap: -31.1%
- Average annual salary for teachers: $45,245
- Average annual earnings for all college graduates: $65,660
- Teacher salary change 1999-00 to 2016-17: 0.9%
6. Washington
Updated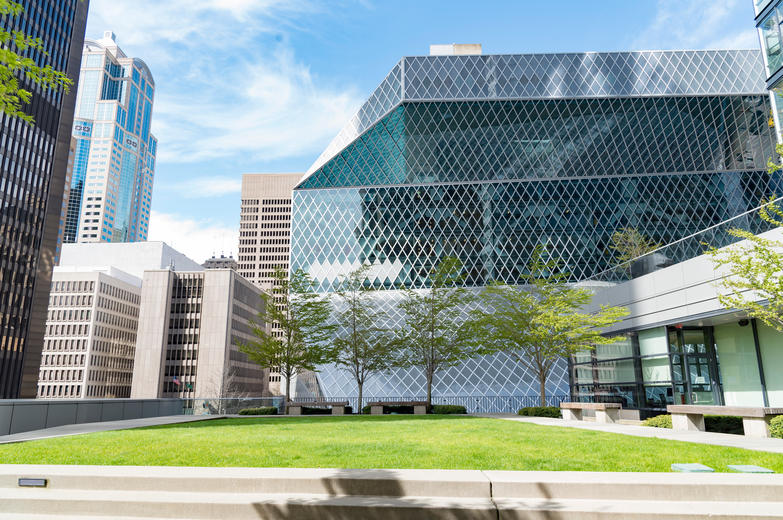
Photo Credit: Richard Theis / Alamy Stock Photo
- Teacher pay gap: -31.8%
- Average annual salary for teachers: $54,147
- Average annual earnings for all college graduates: $79,418
- Teacher salary change 1999-00 to 2016-17: -8.0%
5. Florida
Updated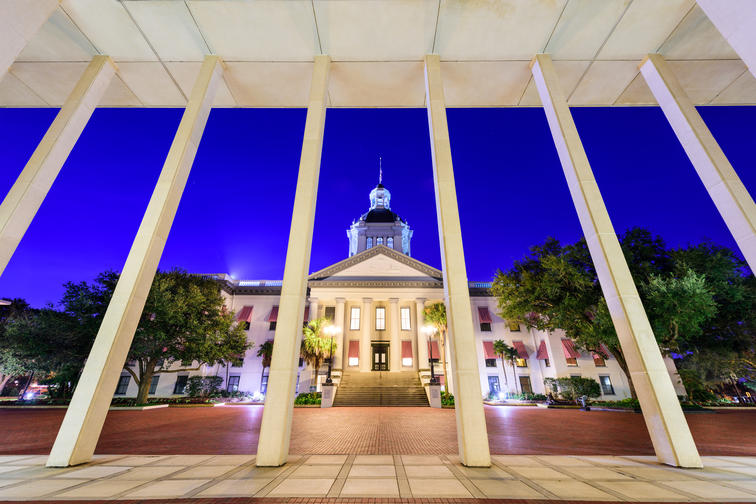
Photo Credit: Sean Pavone / Alamy Stock Photo
- Teacher pay gap: -32.1%
- Average annual salary for teachers: $49,407
- Average annual earnings for all college graduates: $72,804
- Teacher salary change 1999-00 to 2016-17: -6.1%
4. Texas
Updated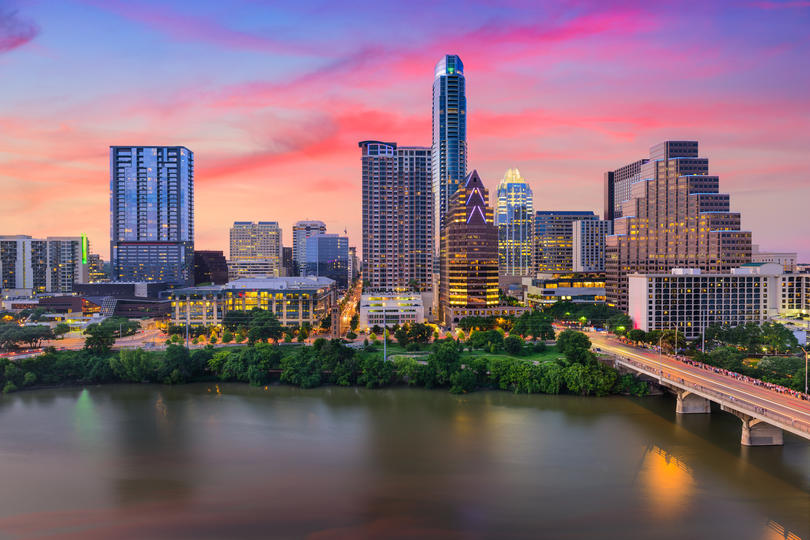
Photo Credit: Sean Pavone / Alamy Stock Photo
- Teacher pay gap: -34.5%
- Average annual salary for teachers: $52,575
- Average annual earnings for all college graduates: $80,261
- Teacher salary change 1999-00 to 2016-17: -2.4%
3. Arizona
Updated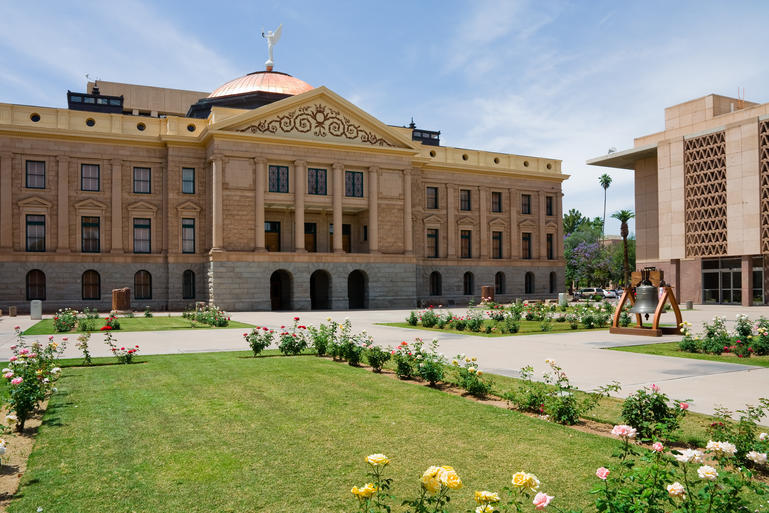
Photo Credit: Andrew Zarivny / Alamy Stock Photo
- Teacher pay gap: -34.7%
- Average annual salary for teachers: $47,403
- Average annual earnings for all college graduates: $72,636
- Teacher salary change 1999-00 to 2016-17: -10.4%
2. Colorado
Updated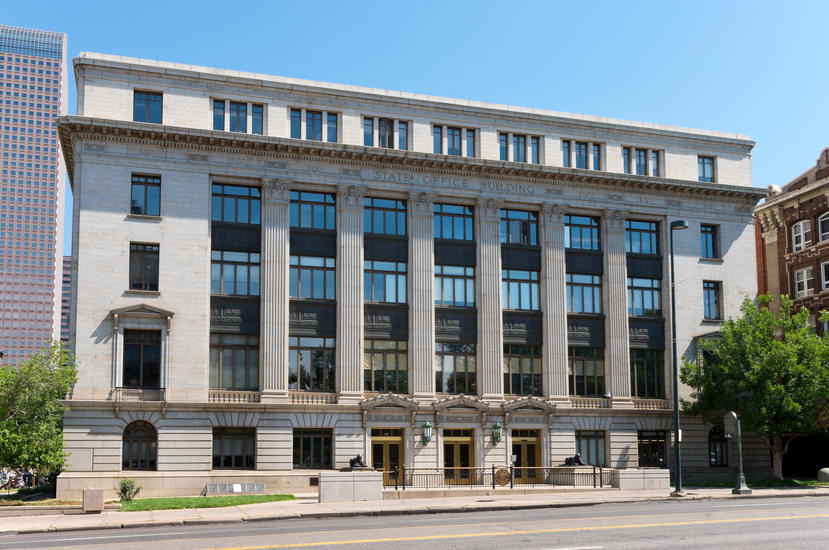
Photo Credit: Joe Ferrer / Alamy Stock Photo
- Teacher pay gap: -37.1%
- Average annual salary for teachers: $46,506
- Average annual earnings for all college graduates: $73,992
- Teacher salary change 1999-00 to 2016-17: -15.0%
1. Virginia
Updated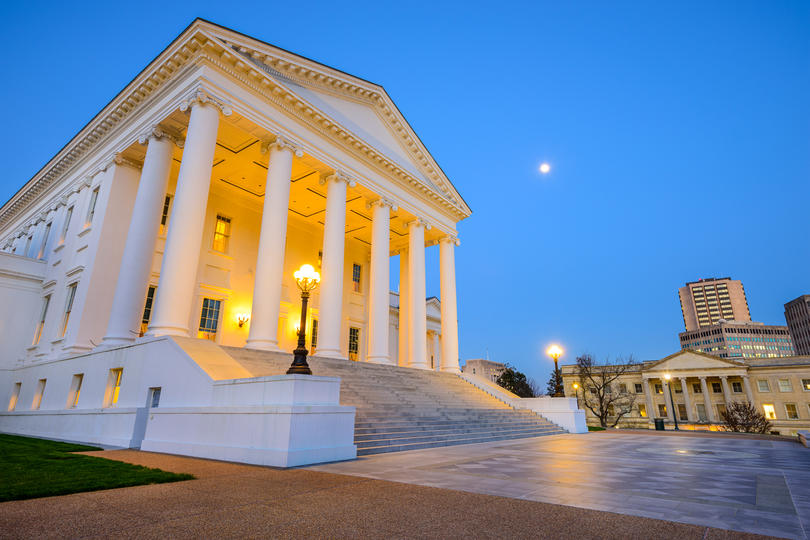
Photo Credit: Sean Pavone / Alamy Stock Photo
- Teacher pay gap: -40.2%
- Average annual salary for teachers: $51,049
- Average annual earnings for all college graduates: $85,432
- Teacher salary change 1999-00 to 2016-17: -8.1%
Methodology and full results
UpdatedTeacher salary and salary change statistics are from the National Education Association, Estimates of School Statistics, 2016-17. Both are in constant 2016-2017 dollars. Average annual earnings for all college graduates was computed for each state using the U.S. Census Bureau, 2016 American Community Survey 1-year Public Use Microdata Samples (PUMS). Only adults over age 18 with a bachelor’s degree or higher were included in the analysis. The Teacher pay gap was calculated as the percent difference between the Average annual salary for teachers and the Average annual earnings for all college graduates.