PHOENIX — While issues surrounding the ongoing pandemic emergency and election laws are likely to command a lot of legislative heat and light, there are dozens of other subjects, great and small, that will be debated.
Ballot initiatives
One of the big battles will be what new hurdles lawmakers will try to put in the path of individuals and groups seeking to propose their own laws.
The voter approval in November of Proposition 208 to raise taxes on the state’s wealthiest to add funding for K-12 education stung the business community, which waged a full-court press against it. Those interests are now working to get a judge to void the 3.5% income tax surcharge on individual earnings above $250,000 and $500,000 for married couples filing jointly.
The Arizona Chamber of Commerce and Industry already is trotting out what it calls “potential reforms” to the system.
One is requiring more than a simple majority of votes to enact any changes. Had that provision been in place, it would have quashed many of the measures voters have approved in recent years, including Proposition 208.
Another proposal is that the required signatures to put measures on the ballot come from each of the state’s 30 legislative districts or what will be its 10 congressional districts after upcoming redistricting.
On one hand, that would ensure that measures cannot qualify for the ballot simply with support from the Phoenix metropolitan area. But the flip side is it would effectively give veto power to residents of any one area of the state.
There also is a proposal to have anything approved by voters self-destruct after a given number of years unless reenacted at the ballot box. That would force those who got a measure approved in the first place to again have to spend money to keep it on the books.
Even if the Republican-controlled Legislature agrees to any or all changes, there is a check on its power. These proposals all need constitutional amendments, which could be approved only if voters ratify them in 2022.
There is one proposal that does not have the support of the business community: Allowing those circulating initiative petitions to use the same online system for gathering signatures that is available for political candidates.
COVID-19 relief
Democrats, who remain in the legislative minority, are hoping to focus attention on the fallout from the COVID-19 pandemic.
“There are a number of Arizonans that are hurting,” said Senate Minority Leader Rebecca Rios, D-Phoenix.
One priority is altering the maximum unemployment benefit available to workers who lose their jobs through no fault of their own. At $240 a week, Arizona’s benefit hasn’t been altered in 17 years. Only Mississippi pays less.
But Republican Gov. Doug Ducey, in an interview with Capitol Media Services, showed no interest in altering that formula.
“We certainly want to make sure that if somebody is displaced that they don’t fall through the cracks and that there’s a social safety net for them,” he said.
“But I want public policy to encourage people to get back into the workforce,” Ducey said.
He acknowledged that the Arizona economy is not back to pre-pandemic levels. In fact, the state Office of Economic Opportunity said the state has recovered just 201,200 of the nearly 295,000 jobs lost since February.
Ducey said he prefers to think of it as the number of people employed now is 96.4% of where it was before the virus hit.
A steady supply of clean water is a privilege we often take for granted. Here are some tips on minimizing waste by reducing water consumption.
But lawmakers run the risk that if they do not take up the issue, there is the chance that voters will — and in a form that, if approved at the ballot, lawmakers cannot change. That’s exactly what happened in 2006 and again in 2016 when voters raised the state minimum wage after the GOP-controlled Legislature refused.
Water
Water will again be a focus, as lawmakers realize the “drought contingency plan” adopted in 2019 is not a permanent and long-term solution.
House Speaker Russell Bowers, R-Mesa, wants to look to “augment” supplies. But that depends on finding people or entities with water rights elsewhere willing to sell them.
At the same time, there is discussion about restricting the transfer of water from one county to another, a concern of some rural lawmakers. They fear developers and cities buying up groundwater rights will leave communities with limited reserves for growth.
Other issues
Among other likely subjects for legislative consideration:
The 10 states that invest the most (and least) in their children's education
Intro
Updated Photo Credit: Alamy Stock Photo
The future of public education funding is always a major topic in the national conversation. In May 2019, the U.S. Census Bureau released the updated Public Elementary-Secondary Education Finance Data for fiscal year 2017. According to the survey, total educational revenue for public elementary and secondary schools in the U.S. was $694 billion in 2017, representing an overall increase from $671 billion in 2016.
How is public education funded?
While a small amount of school funding comes from the federal government, most educational revenue comes from a combination of state sources ($327 billion) and local sources ($312 billion).
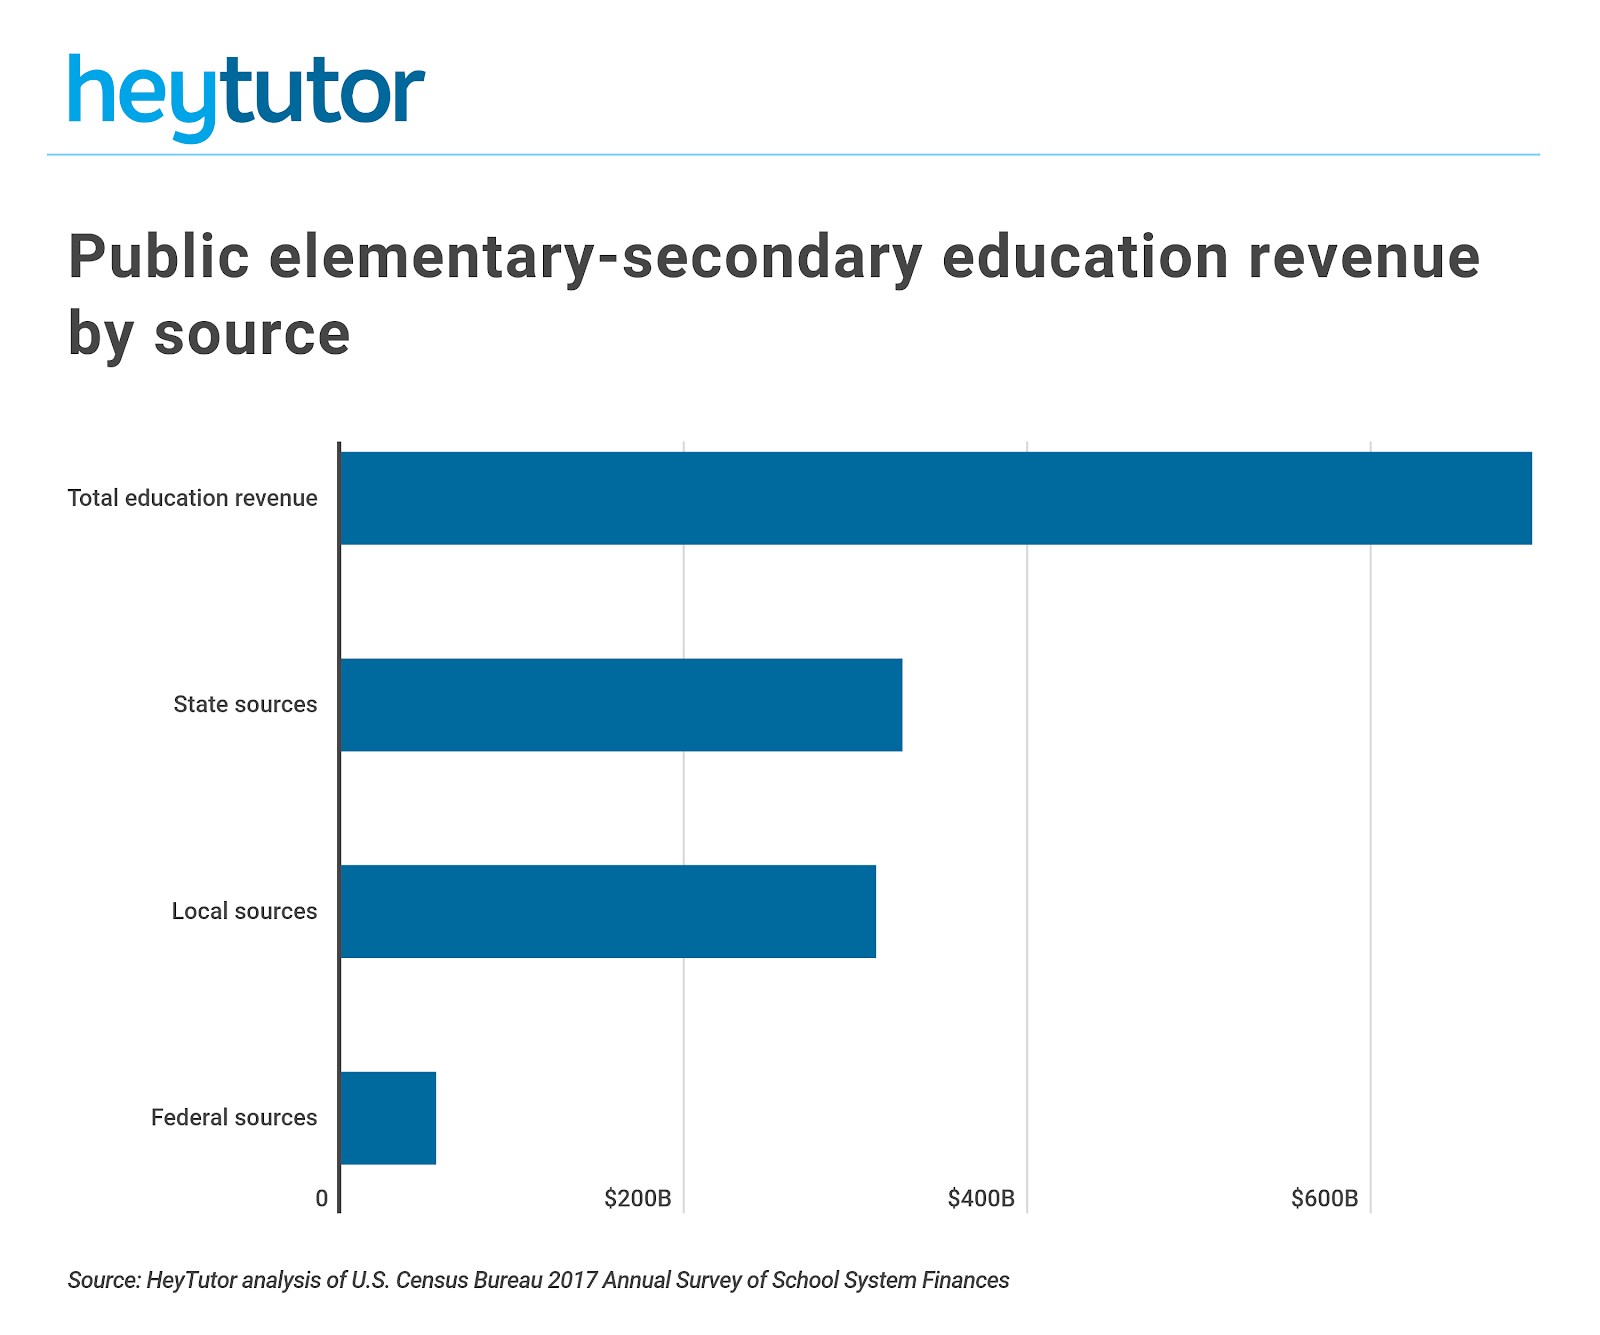
For example, local governments collect property taxes, a portion of which is put towards education. Across the entire U.S., the amount of local property taxes put towards public elementary-secondary education was $203 billion in 2017, making it one of the largest sources of public education funding. With such heavy reliance on property taxes for school funding, impoverished areas generally have less money to spend on their students. However, low-income students require more resources to succeed academically, and experts believe this inequality of educational access ultimately leads to gaps in academic and economic outcomes later in life.
What are funds used for?
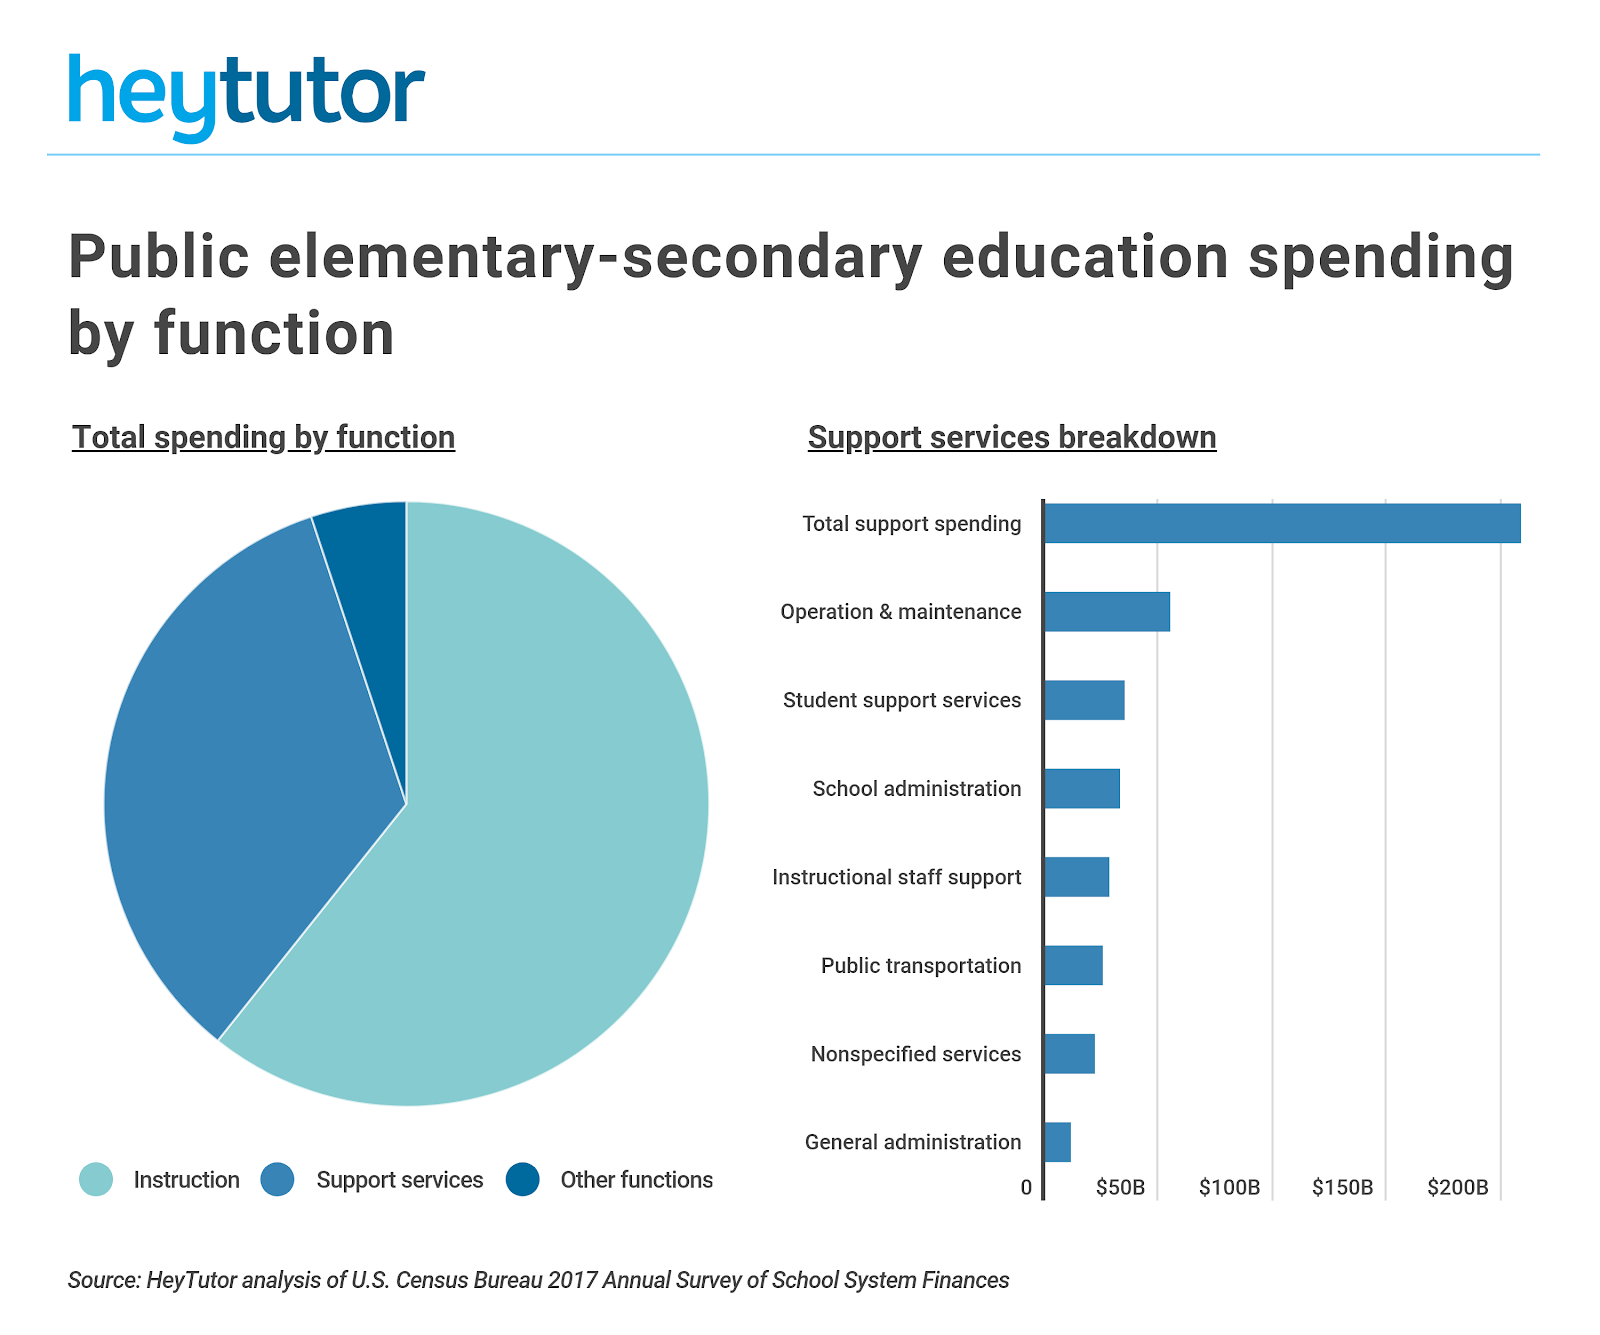
Of the funds spent on public and secondary education, the majority goes toward instruction and administrative support. More specifically, schools spent $326 billion for teacher salaries and benefits in 2017. In addition, $209 billion went to support services, which include general administration, school administration, public transportation, and operations.
Does funding impact outcomes?
With 48.6 million total students enrolled in public primary and secondary schools in 2017, per pupil spending was $12,201, an increase of 3.6 percent compared to 2016. At the state level, per pupil spending ranges from a high of $23,091 to a low of $7,179 per year.
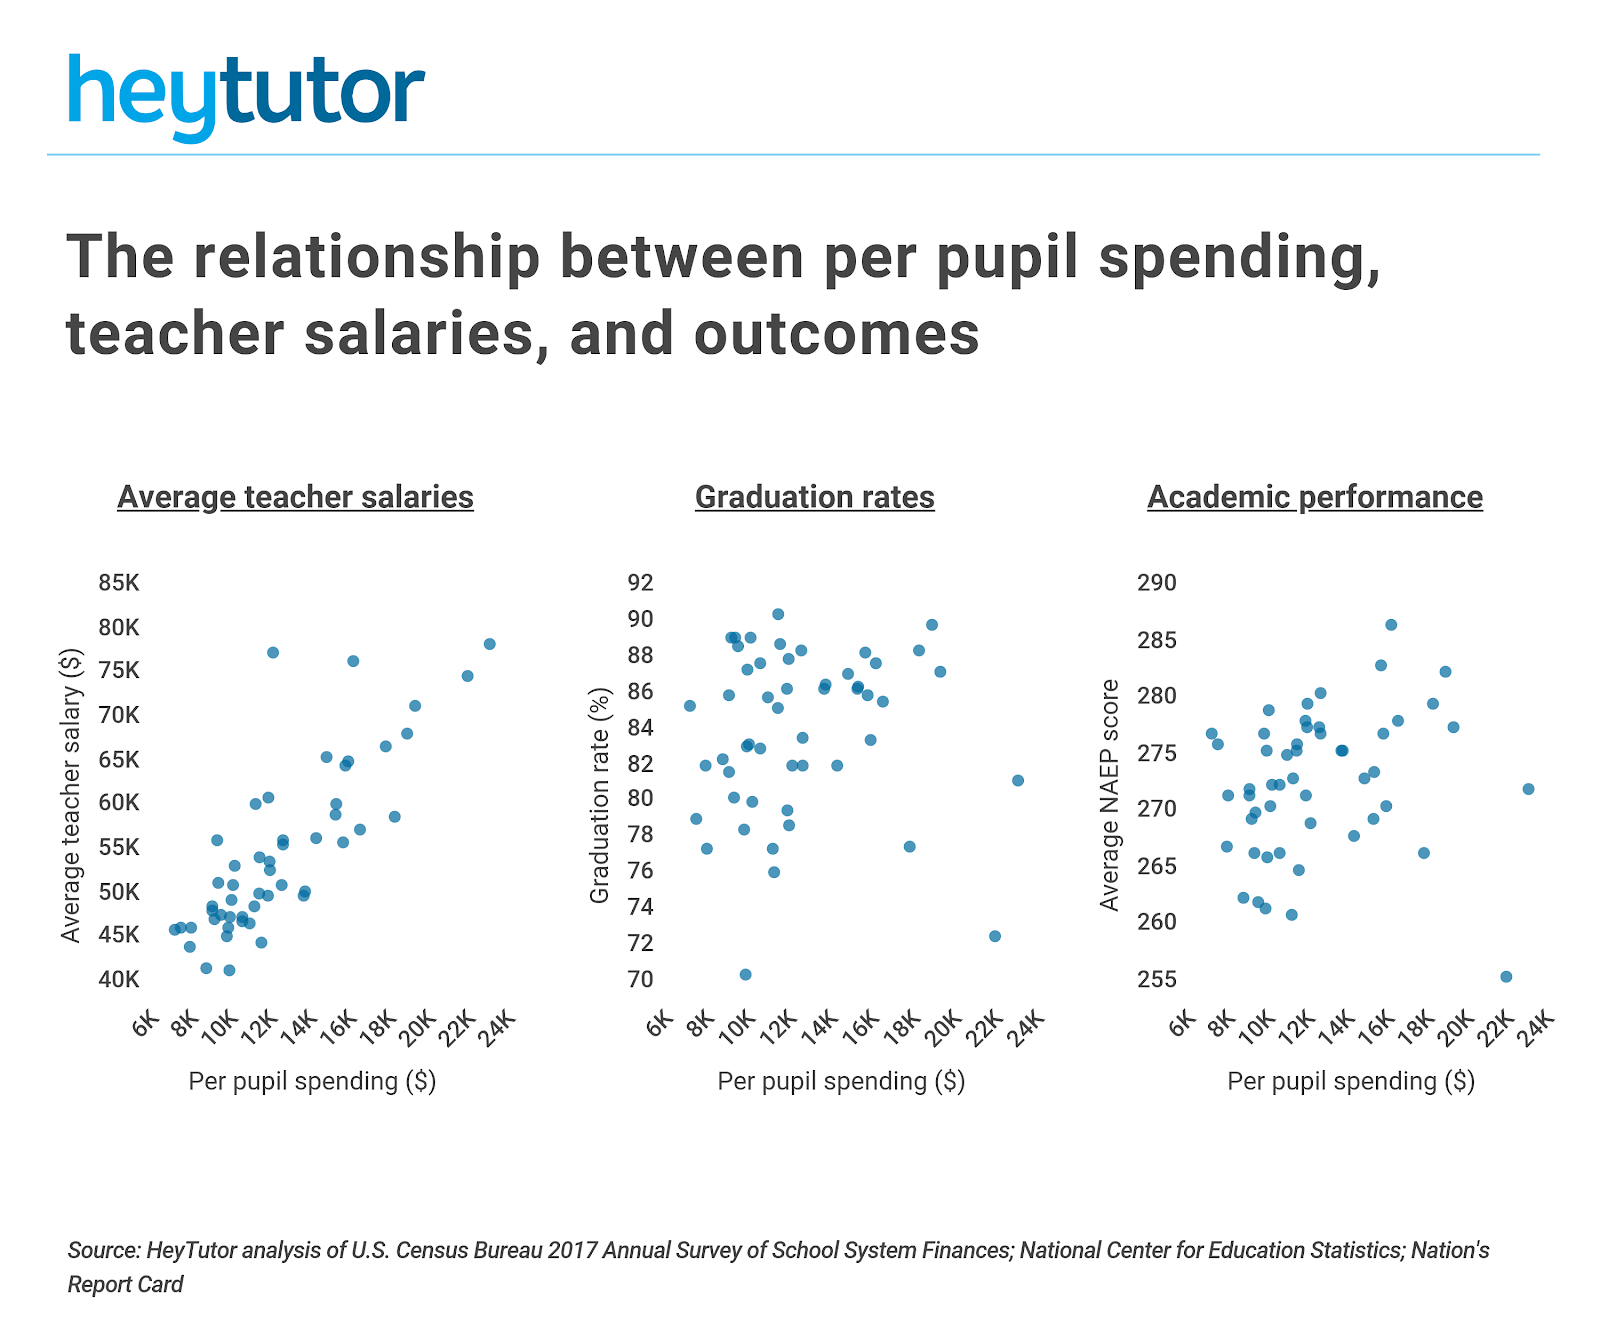
Perhaps not surprisingly, there is a strong correlation between per pupil spending and teacher salaries across states. The average teacher salary nationwide is $58,950, but the state average varies significantly. For example, the average teacher in South Dakota makes $42,668 per year; whereas the average teacher in New York makes $79,637.
While teacher salaries are directly affected by school funding, the correlation between student performance and education funding is more complex. Looking at data from fiscal year 2017, states that spend more per student aren’t more likely to have better outcomes. The nationwide high school graduation rate is 84.6 percent, and at the state level, there is no clear correlation with per pupil spending. Academic performance, as measured by test scores in math and reading, also show no correlation with per pupil spending based on data from the Nation’s Report Card.
At first glance, this snapshot of data might suggest that academic performance is independent of spending and that additional investment in education is not needed. However, test scores and graduation rates are not the only measures of academic performance and only looking at a single point in time can’t paint a comprehensive picture of the variety of factors at play. A large body of academic research suggests that more funding does have positive effects on student outcomes.
A 2015 study of school finance reforms found that a 10 percent increase in per pupil spending each year for all 12 years of public school results in 0.31 more completed years of education, 7 percent higher wages, and a 3.2 percentage point reduction in adult poverty. The effects were much more pronounced for low-income students, who tend to have lower levels of literacy, higher dropout rates, and lower matriculation rates.
A 2017 report released by the Johns Hopkins Institute for Education Policy indicated that increased funding can be effective for student outcomes when applied to a particular set of conditions, such as reducing class sizes or creating more educational opportunities for disadvantaged students. The same study also suggests that funding dual enrollment programs, in which high school students take courses for college credit, have been proven to increase academic achievement. A 2018 report by the Learning Policy Institute reached similar conclusions, underscoring the importance of applying school funding strategically to yield the best student outcomes.
Given this body of research and large disparities in educational spending among states, HeyTutor wanted to find which states invest the most and least per student on public education. HeyTutor’s researchers analyzed data from the U.S. Census Bureau, National Center for Education Statistics, and the Nation’s Report Card. They looked at per pupil spending as well as academic performance across all states.
The states spending the most on public education tend to be located in the Northeast, while those spending the least are located in the West or the South. Here are the states spending the most and least on public education:
States spending the most on public education
10. Pennsylvania
Updated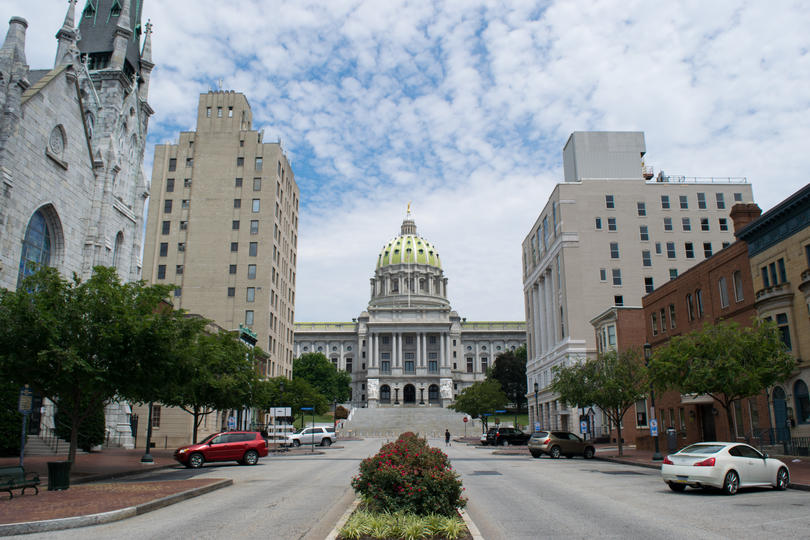
Photo Credit: Alamy Stock Photo
- Total spending per student: $15,798
- Instructional spending per student: $9,719
- Support services spending per student: $5,474
- Total spending: $27.51 billion
- Average teacher salary: $65,863
- Graduation rate: 86.6%
- Academic performance: Above average
9. Rhode Island
Updated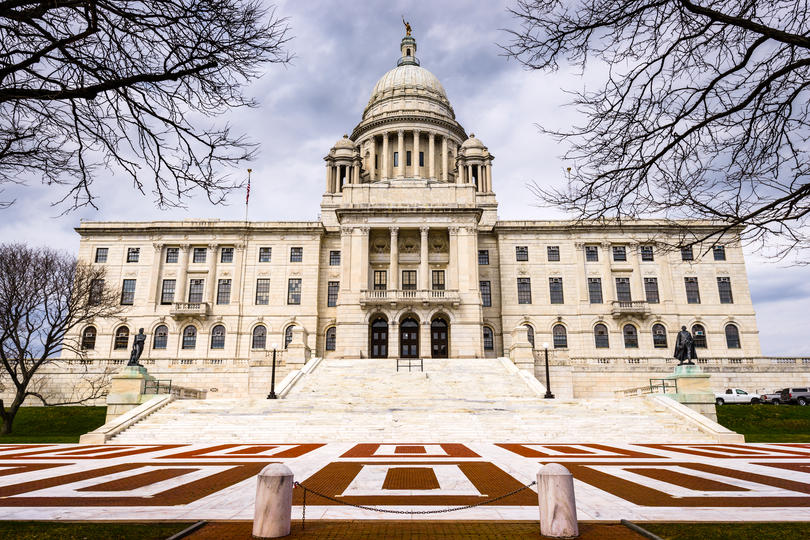
Photo Credit: Alamy Stock Photo
- Total spending per student: $15,943
- Instructional spending per student: $9,299
- Support services spending per student: $6,193
- Total spending: $2.31 billion
- Average teacher salary: $66,477
- Graduation rate: 84.1%
- Academic performance: Below average
8. Massachusetts
Updated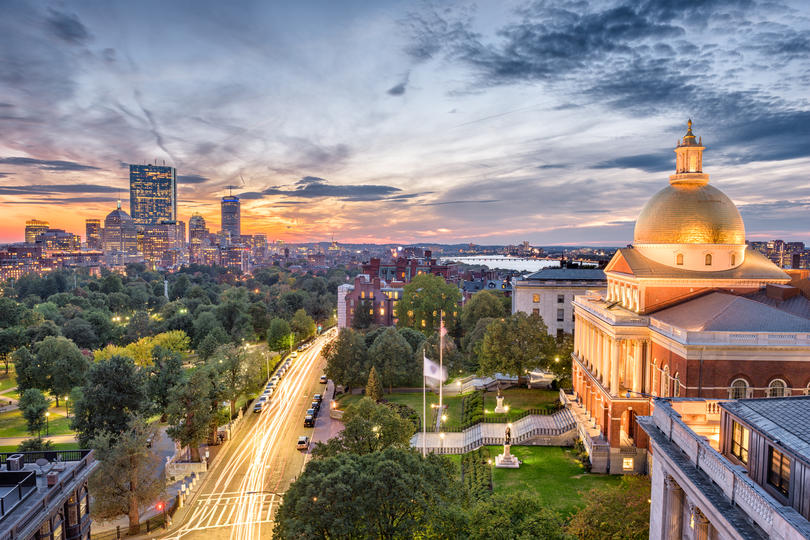
Photo Credit: Alamy Stock Photo
- Total spending per student: $16,197
- Instructional spending per student: $10,060
- Support services spending per student: $5,620
- Total spending: $16.11 billion
- Average teacher salary: $77,804
- Graduation rate: 88.3%
- Academic performance: Significantly above average
7. Wyoming
Updated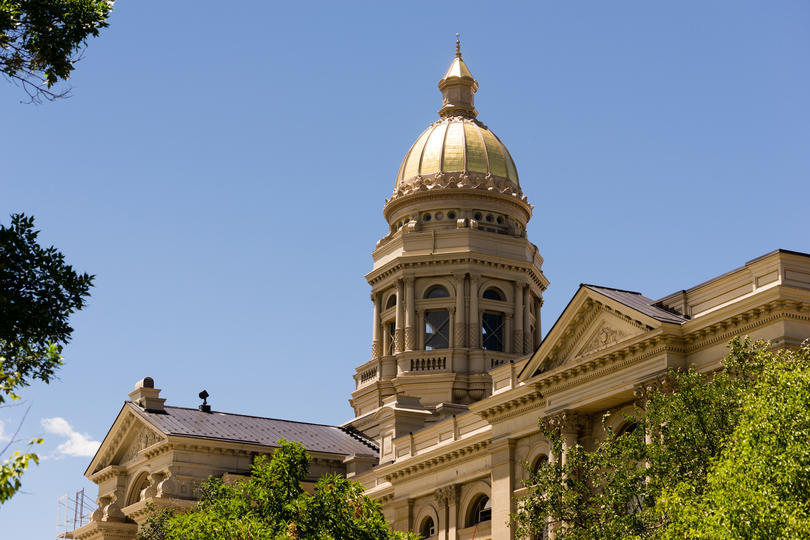
Photo Credit: Alamy Stock Photo
- Total spending per student: $16,537
- Instructional spending per student: $9,779
- Support services spending per student: $6,265
- Total spending: $1.56 billion
- Average teacher salary: $58,650
- Graduation rate: 86.2%
- Academic performance: Above average
6. Alaska
Updated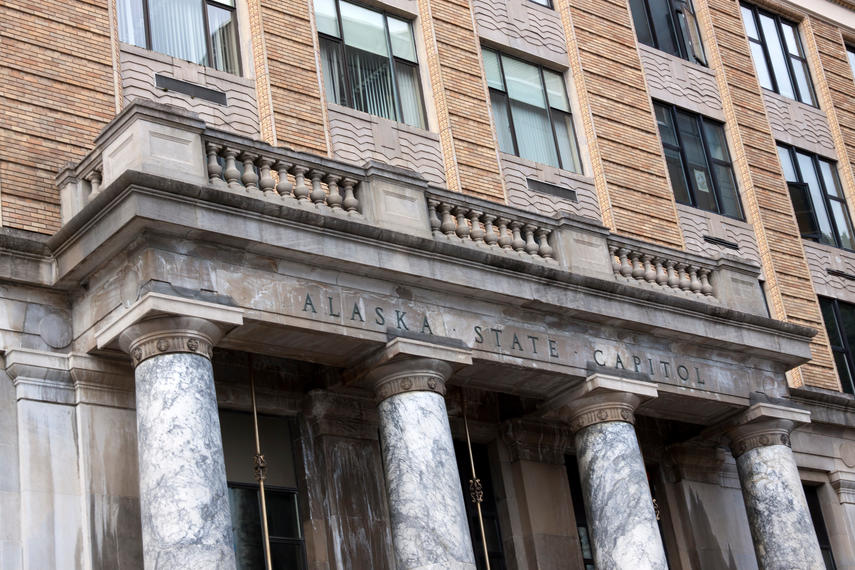
Photo Credit: Alamy Stock Photo
- Total spending per student: $17,838
- Instructional spending per student: $9,538
- Support services spending per student: $7,638
- Total spending: $2.38 billion
- Average teacher salary: $68,138
- Graduation rate: 78.2%
- Academic performance: Below average
5. Vermont
Updated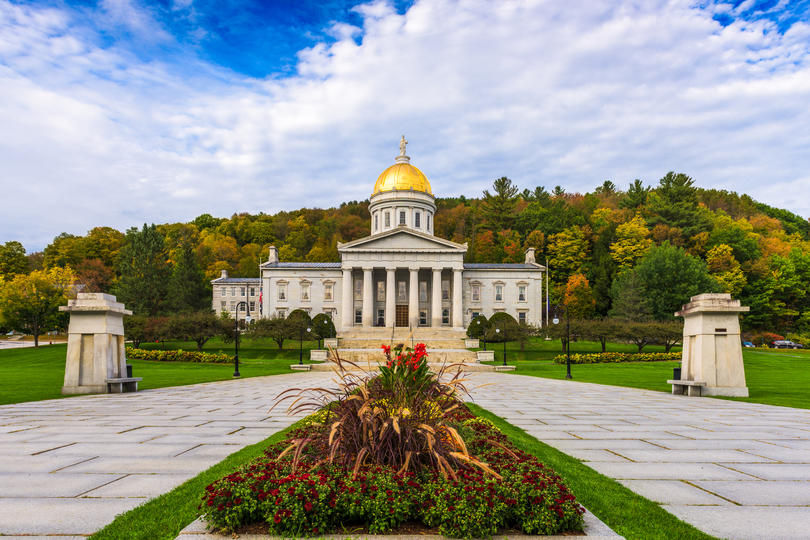
Photo Credit: Alamy Stock Photo
- Total spending per student: $18,290
- Instructional spending per student: $11,039
- Support services spending per student: $6,743
- Total spending: $1.69 billion
- Average teacher salary: $60,187
- Graduation rate: 89.1%
- Academic performance: Significantly above average
4. New Jersey
Updated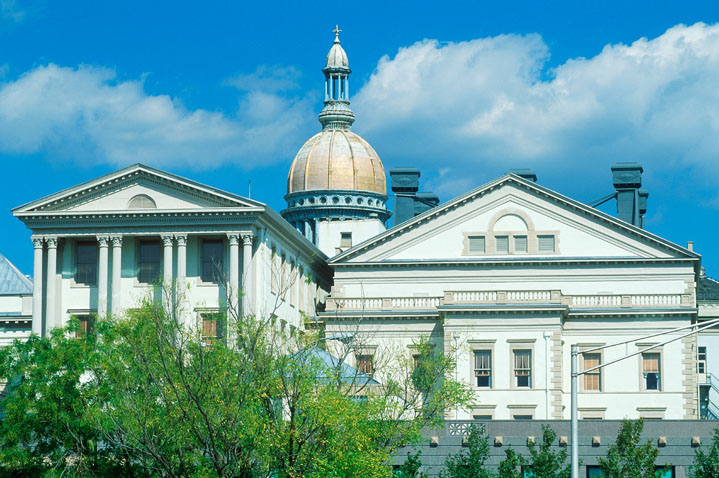
Photo Credit: Alamy Stock Photo
- Total spending per student: $18,920
- Instructional spending per student: $11,076
- Support services spending per student: $7,208
- Total spending: $27.45 billion
- Average teacher salary: $69,623
- Graduation rate: 90.5%
- Academic performance: Significantly above average
3. Connecticut
Updated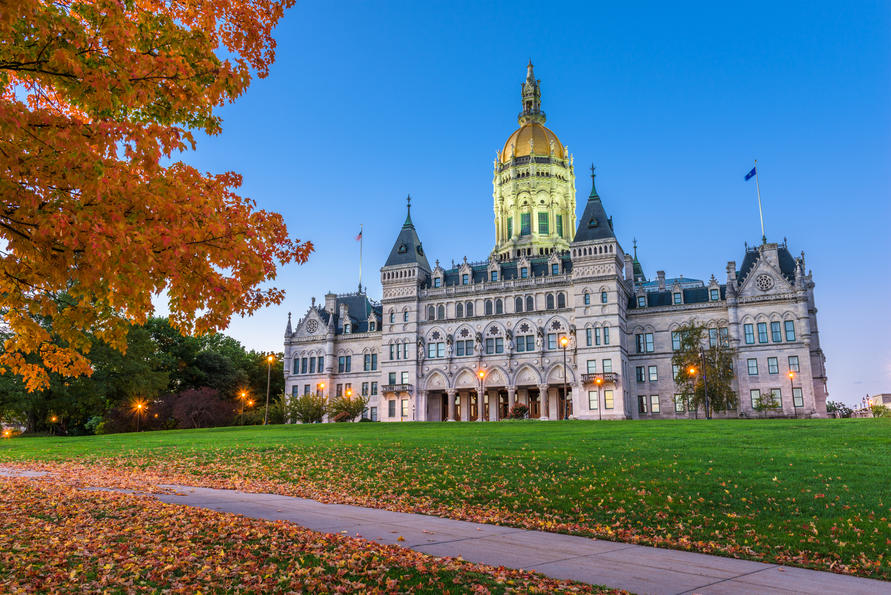
Photo Credit: Alamy Stock Photo
- Total spending per student: $19,322
- Instructional spending per student: $11,861
- Support services spending per student: $6,775
- Total spending: $9.92 billion
- Average teacher salary: $72,561
- Graduation rate: 87.9%
- Academic performance: Above average
2. District of Columbia
Updated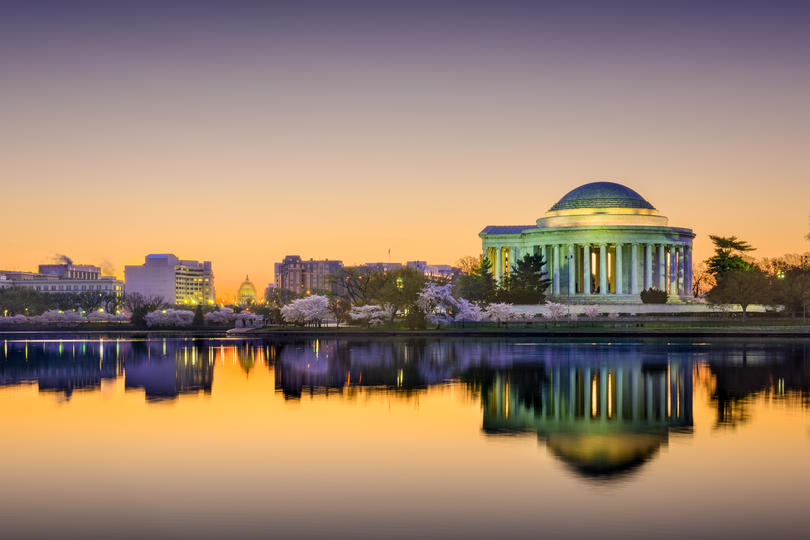
Photo Credit: Alamy Stock Photo
- Total spending per student: $21,974
- Instructional spending per student: $12,195
- Support services spending per student: $8,930
- Total spending: $1.15 billion
- Average teacher salary: $76,131
- Graduation rate: 73.2%
- Academic performance: Significantly below average
1. New York
Updated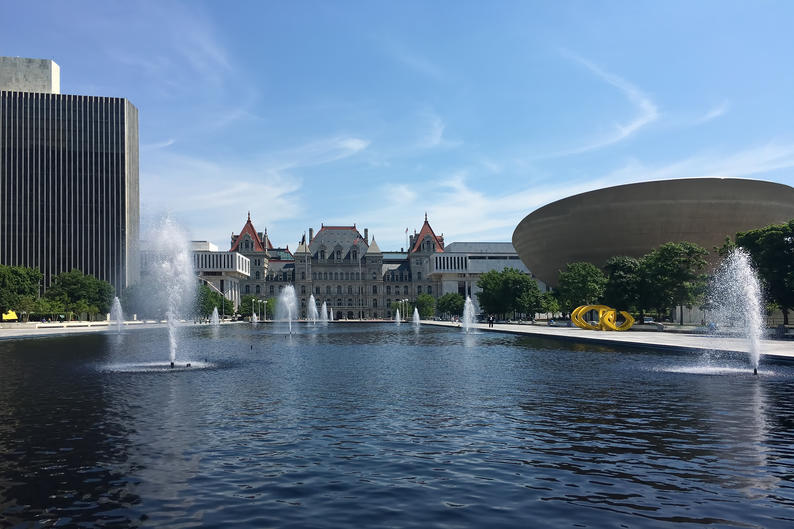
Photo Credit: Alamy Stock Photo
- Total spending per student: $23,091
- Instructional spending per student: $16,113
- Support services spending per student: $6,480
- Total spending: $63.62 billion
- Average teacher salary: $79,637
- Graduation rate: 81.8%
- Academic performance: Average
States spending the least on public education
10. Texas
Updated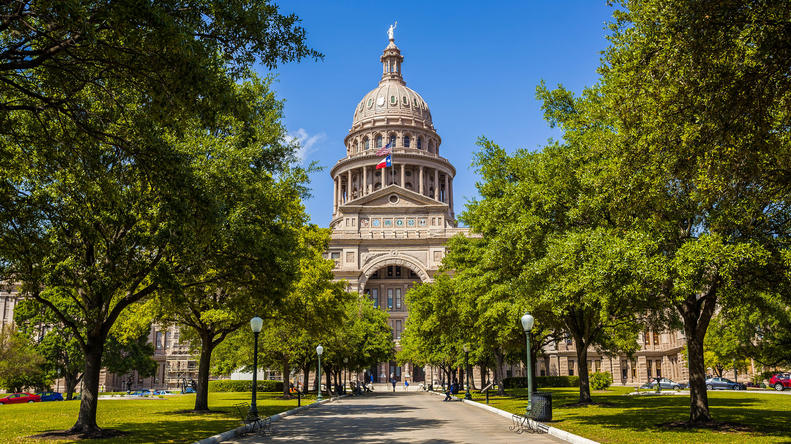
Photo Credit: Alamy Stock Photo
- Total spending per student: $9,375
- Instructional spending per student: $5,542
- Support services spending per student: $3,338
- Total spending: $48.03 billion
- Average teacher salary: $52,575
- Graduation rate: 89.7%
- Academic performance: Below average
9. Nevada
Updated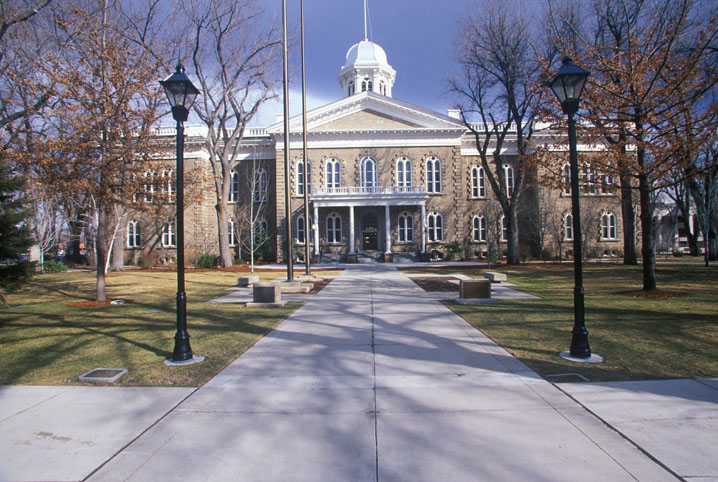
Photo Credit: Alamy Stock Photo
- Total spending per student: $9,320
- Instructional spending per student: $5,472
- Support services spending per student: $3,467
- Total spending: $4.15 billion
- Average teacher salary: $57,376
- Graduation rate: 80.9%
- Academic performance: Below average
8. Tennessee
Updated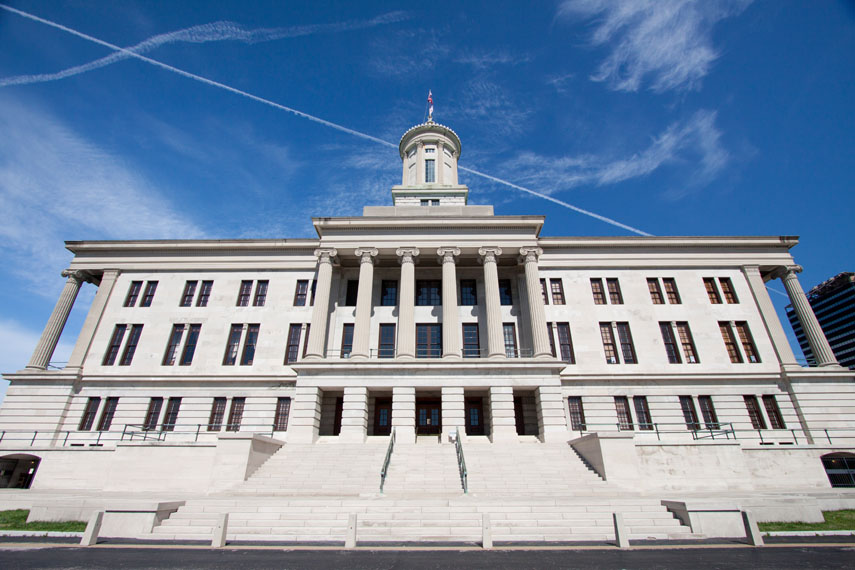
Photo Credit: Alamy Stock Photo
- Total spending per student: $9,184
- Instructional spending per student: $5,584
- Support services spending per student: $3,090
- Total spending: $9.27 billion
- Average teacher salary: $48,456
- Graduation rate: 89.8%
- Academic performance: Below average
7. Florida
Updated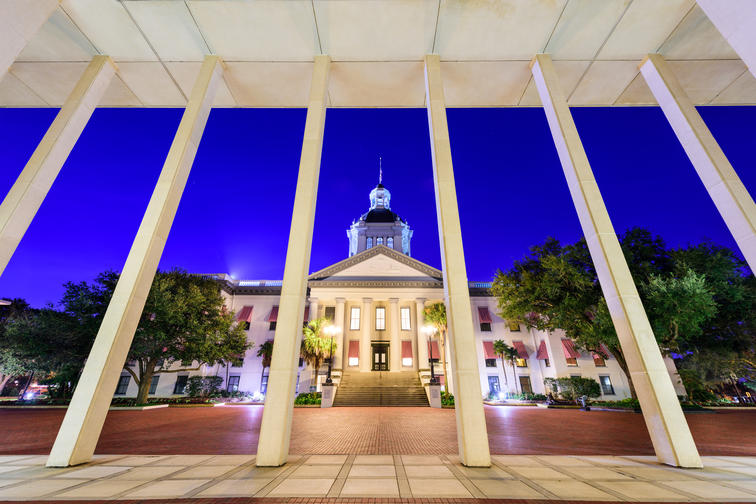
Photo Credit: Alamy Stock Photo
- Total spending per student: $9,075
- Instructional spending per student: $5,593
- Support services spending per student: $3,012
- Total spending: $26.00 billion
- Average teacher salary: $49,407
- Graduation rate: 82.3%
- Academic performance: Average
6. North Carolina
Updated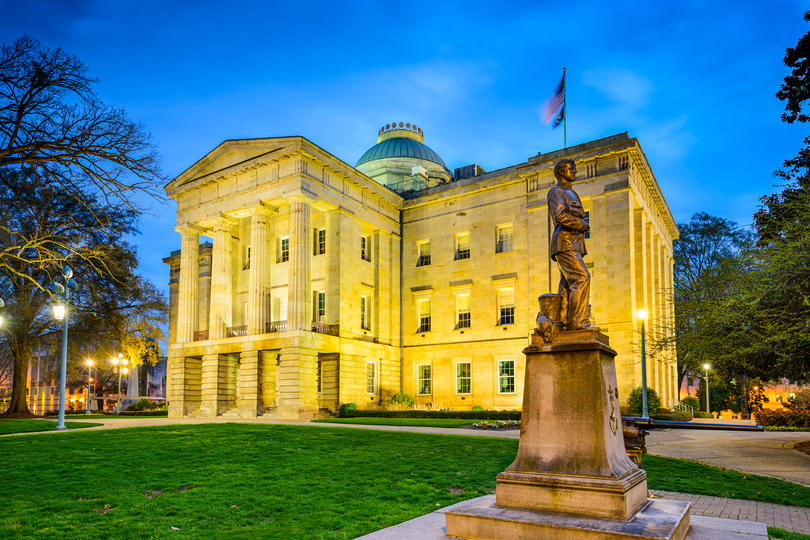
Photo Credit: Alamy Stock Photo
- Total spending per student: $9,072
- Instructional spending per student: $5,712
- Support services spending per student: $2,888
- Total spending: $13.29 billion
- Average teacher salary: $49,837
- Graduation rate: 86.6%
- Academic performance: Average
5. Mississippi
Updated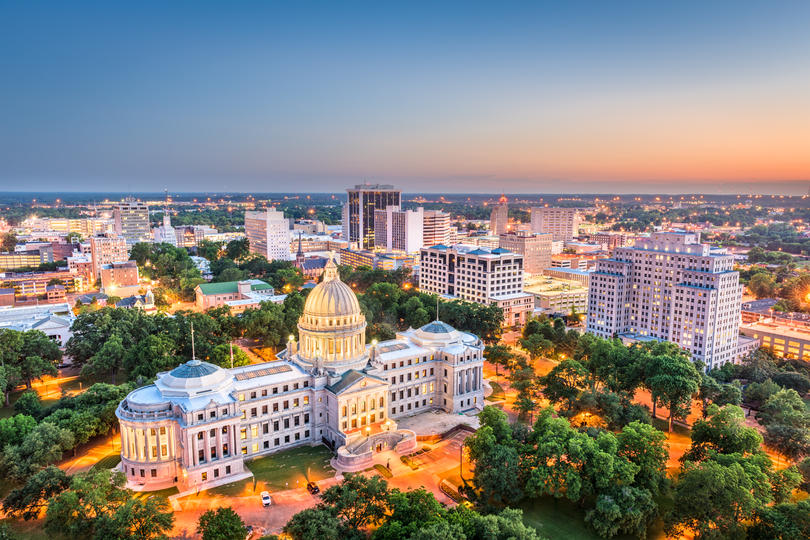
Photo Credit: Alamy Stock Photo
- Total spending per student: $8,771
- Instructional spending per student: $4,971
- Support services spending per student: $3,235
- Total spending: $4.24 billion
- Average teacher salary: $42,925
- Graduation rate: 83.0%
- Academic performance: Significantly below average
4. Arizona
Updated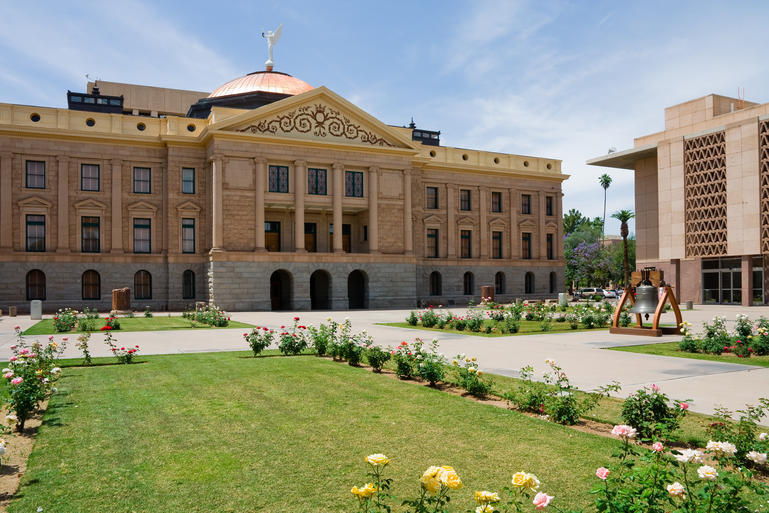
Photo Credit: Alamy Stock Photo
- Total spending per student: $8,003
- Instructional spending per student: $4,308
- Support services spending per student: $3,260
- Total spending: $7.63 billion
- Average teacher salary: $47,403
- Graduation rate: 78.0%
- Academic performance: Average
3. Oklahoma
Updated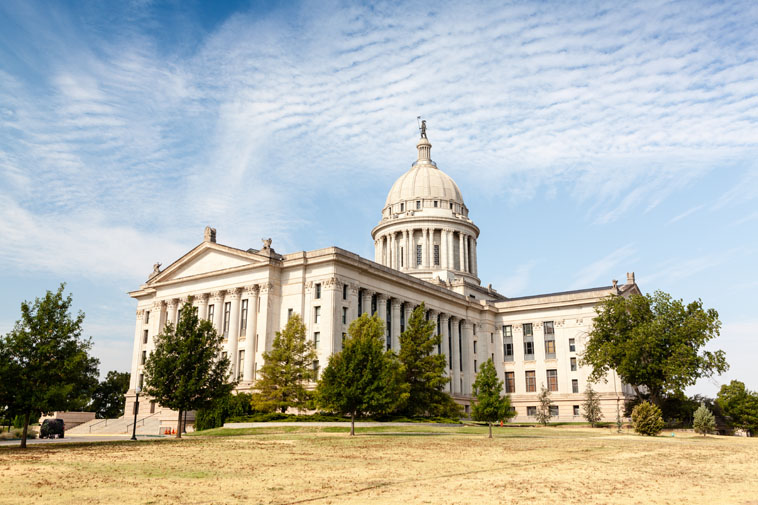
Photo Credit: Alamy Stock Photo
- Total spending per student: $7,940
- Instructional spending per student: $4,447
- Support services spending per student: $2,913
- Total spending: $5.34 billion
- Average teacher salary: $45,245
- Graduation rate: 82.6%
- Academic performance: Below average
2. Idaho
Updated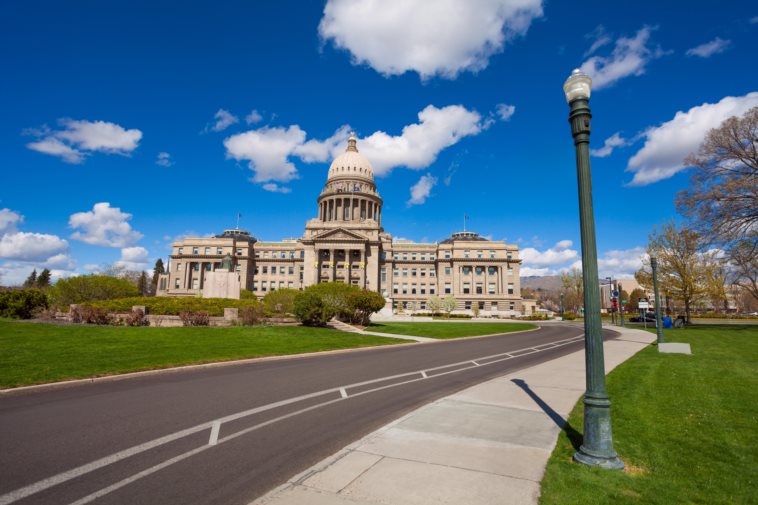
Photo Credit: Alamy Stock Photo
- Total spending per student: $7,486
- Instructional spending per student: $4,435
- Support services spending per student: $2,667
- Total spending: $2.09 billion
- Average teacher salary: $47,504
- Graduation rate: 79.7%
- Academic performance: Above average
1. Utah
Updated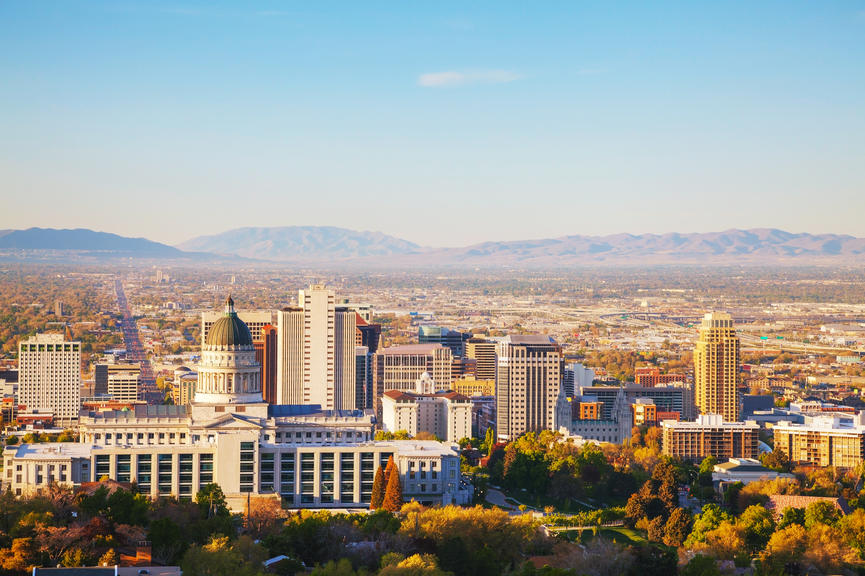
Photo Credit: Alamy Stock Photo
- Total spending per student: $7,179
- Instructional spending per student: $4,594
- Support services spending per student: $2,173
- Total spending: $4.28 billion
- Average teacher salary: $47,244
- Graduation rate: 86.0%
- Academic performance: Above average
Methodology and full results
UpdatedSpending and enrollment statistics are from the U.S. Census Bureau 2017 Annual Survey of School System Finances, released in 2019. Average teacher salaries and graduation rates are from the National Center for Education Statistics. The graduation rate shown is the high school 4-year adjusted cohort graduation rate. Academic performance is derived from the Math and Reading assessments of the Nation’s Report Card.
All of the data is for public elementary and secondary schools only. States are ordered by the per student spending for 2017. For a complete list of results for all states, see the original version on HeyTutor.


