


In the wild weeks leading up to the House settlement that is fundamentally changing college sports this month, the rumors and speculation kept coming.
Were college basketball players really getting $1 million to $4 million in the spring transfer portal, so much money that even projected NBA Draft picks were returning to school? Were booster-funded collectives really amassing up to $40 million for their 2025 football rosters?

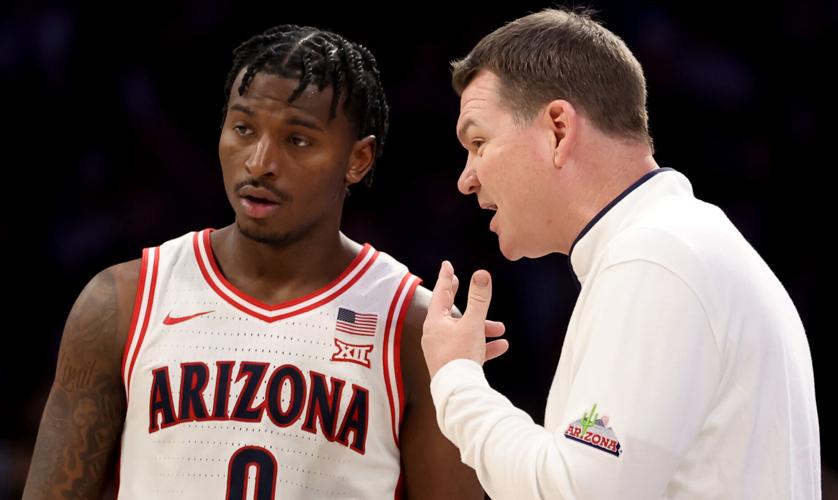
Arizona coach Tommy Lloyd, right, has some words for guard Jaden Bradley during a Wildcat free throw in the second half against Utah on Feb. 26, at McKale Center.
Was it all because NIL collectives were slipping in last-gasp deals before the “NIL GO” clearinghouse goes into effect as a provision of the House settlement? (According to a Yahoo report, auditor Deloitte said 70% of past NIL collective deals would be struck down by NIL GO).
And, with collectives pushed to the fringe, are schools now really going to pay their football and men’s basketball regulars six-figure “revenue-sharing” salaries starting in 2025-26?
All that pretty much looks true, at least according to the 2024-25 annual report that Opendorse released this week.
An NIL platform and advisory firm, Opendorse said NIL deals for men’s basketball players rose 5.3 times in the weeks following the transfer portal’s March opening, and overall collective spending was up 242% year over year in June. The firm said it based its data by analyzing collective, collegiate and commercial deals and budgets through June 25, 2025.
“The concept of ‘front loading’ payments — stacking collective payments prior to the approval of the House settlement and subsequent July 1 cap year — was not just a theortetical possibility,” Opendorse wrote. “The data proved it.”
The trend accelerated dramatically as the House settlement neared, with collective spending spiking 182% between April 2025 from April 2024 and up 824% from June 2024 to June 2025, when the House settlement was approved.
The House settlement led to the creation of the College Sports Commission, which is overseeing NIL GO and has also developed a “College Athlete Payment System” (CAPS) in which schools are required to report their revenue-sharing payments.
It is possible NIL collectives will still survive, with lawsuits already popping up that could challenge limiting athletes’ income in any form. One in Michigan even proposes to make it illegal for the state’s schools to report deals to NIL GO, while in Arizona, a provision in a state NIL bill that Arizona schools could only allow NIL payments “to the extent allowed” by the NCAA was struck before it became law.
But for now, Opendorse forecasts dramatic decreases in collective spending while schools start footing the bill. Opendorse forecasted average collective spending dropping from $1.3 billion in 2024-25 to just $227 million in 2025-26, while college spending rises from zero before House to $1.5 billion in 2025-26.
Braly Keller, Opendorse’s director of collegiate services and insights, said the landscape could shift again, noting that collectives were “barely more than an idea” when NIL began in July 2021 before becoming a game-changing force.
“It’d be foolish to say new ideas couldn’t emerge,” Keller said via email. “That said, the CSC, NIL GO, and CAPS systems have been designated under the terms of the settlement to limit workarounds. The intention is to create a defined spending environment for businesses and schools, but as we’ve seen before, time will tell how strictly that holds up — and how lawsuits might reshape it if successful.”
In 2025-26, the $1.5 billion that colleges are expected to pay represents 54.5% of what athletes are forecasted to earn, with collectives contributing just the $227 million and commercial NIL payments expected to be $994.9 million.
While power conference schools are expected to pay out the maximum of $20.5 million in revenue-sharing money to their athletes in 2025-26, Arizona and the vast majority are not making public the percentages they will pay each sport, likely for competitive and recruiting reasons.
But Opendorse, citing data from deals and budgets, said power conference schools would divvy out an average of 65.6% to football, 20.3% to men’s basketball, 6.6% to women’s basketball and 7.5% to other sports.
Keller said Opendorse is aware that some schools may be “placing a higher emphasis” on revenue sharing for sports in which they are traditionally strong, such as basketball, baseball, hockey or even Olympic sports at some colleges.
So, for example, if Arizona gave 21% to its men’s basketball program, that would be a total of $4.3 million, and Keller says 80% of that likely goes to starters and 20% to backups and key role players. That suggests UA’s top five or six players could receive an average of about $600,000 each.
Or to view it by position, Opendorse estimates high-major men’s basketball teams will give an average of 53.2% of the sport’s allocation to their guards, 37.3% to forwards and 9.5% to centers.
Under that formula, UA would pay its guards $2.23 million, with its two projected starters earning as much as $1.83 million combined. UA would distribute $1.6 million to its forwards, with $1.28 million for two starting forwards.
In football, if UA allocates the standard $13.4 million to football and pays out the averages to position groups that Opendorse forecasts, its quarterbacks would collectively earn $2.26 million (with the starter earning $1.81 million, or 80% of that number.) The averages suggest UA’s wide receiver group would earn $2 million and starting wide receivers would make $1.6 million together.

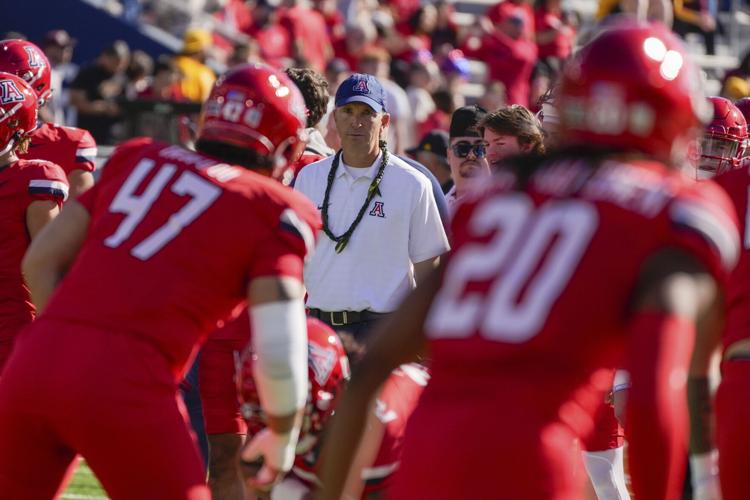
Arizona head coach Brent Brennan watches his players warm up before the Arizona State game, Nov. 30, 2024, in Tucson.
But those numbers may vary widely. UA’s men’s basketball program is believed to favor more compensation for returning players than incoming ones, while Keller said local market dynamics, coaching philosophy and school choices also play into the decisions.
Keller noted that while a power four starting men’s basketball center could theoretically be worth about $400,000 (if he received all 9.5% of the center allocation out of the sport’s 20.3% pool within the school’s $20.5 million payments) but that the pool can be defined in different ways.
“It would be distributed across starters, rotation players and potentially even backups depending on how a school structures its allocations,” Keller said.
Here are some other key findings in Opendorse’s report:
Average revenue-sharing pools, percentages allotted for each sport
Power conferences (ACC, Big 12, Big Ten, SEC):
– Total pool: $20.5 million
– Football: $13.4 million (65.5%)
– Men’s basketball: $4.16 million (20.3%)
– Women’s basketball: $1.35 million (6.6%)
– Other sports: $1.52 million (7.5%)
Group of 6 (AAC, C-USA, MAC, Mountain West, Pac-12, Sun Belt):
– Total pool: $4.3 million
– Football: $2.66 million (61.9%)
– Men’s basketball: $920,020 (21.4%)
– Women’s basketball: $404,200 (9.4%)
– Other sports: $313,900 (7.3%)
All other D-I schools:
– Total pool: $4.8 million
– Men’s basketball: $2.68 million (55.4%)
– Football: $1.31 million (27.3%)l
– Women’s basketball: $484,800 (10.1%)
– Other sports: $350,400 (7.3%)
Position group allotments
The average revenue-share payments per position group:
Football

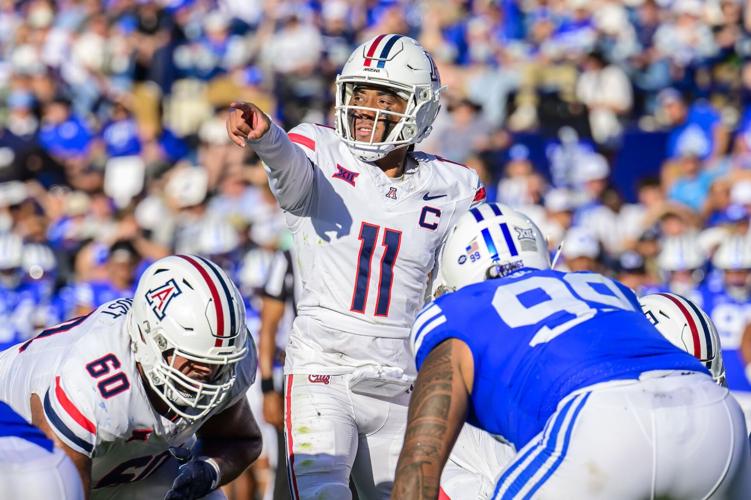
Arizona quarterback Noah Fifita, center, points toward the defense at the line of scrimmage during a game against BYU on Oct. 12, 2024, in Provo, Utah.
– Quarterback: 16.9%
– Wide receiver: 15.4%
– Defensive line: 13.7%
– Defensive back: 13.0%
– Linebacker: 11.9%
– Running back: 8.9%
– Tight end: 4.5%
– Specialist: 1.5%
Men’s basketball
– Guards: 53.2%
– Forwards: 37.3%
– Centers: 9.5%
Women’s basketball
– Guards: 31.0%
– Forwards: 16.4%
– Centers: 52.6%
All conference performers can earn millions
Opendorse says the Top 5% earners among high-major power forwards in men’s basketball are worth an average of $2.6 million annually. While “top earners” is not necessarily the same as top players, the top 5% roughly corresponds with players receiving all-conference honors.
In high major women’s basketball, the top five earning guards have an average annual value of $285,000.
Time (and points) are money
Opendorse said its data “reveal a strong connection between on-court production and NIL earnings.”
It said high-major men’s basketball players earned a $125,000 boost for every 1.0 point added to their average, and a $23,000 boost for every additional minute played. Among mid-major players, their value jumped an average of $47,000 for every extra point and $7,000 for every extra minute.
Among high major women’s basketball players, a 1.0 scoring increase translated to an average of $21,000 more and an extra minute was worth $3,000.
Payments spiked after portal opened
Multiple sports saw huge jumps in the value of NIL deals after their transfer portal window opened. According to Opendorse, in the weeks following a transfer portal opening NIL payments went up as follows:
– Football: 1.6% (December window), 1.2% (April)
– Men’s basketball: 5.3%
– Baseball: 1.8%
– Women’s basketball: 3.1%
– Softball: 6.9%
– Women’s volleyball: 3.0%
While schools pay women less, businesses pay more
Opendorse said after removing football, women’s sports athletes earn more as social media influencers than men by a 60-40 split. It also said a comparison of the top 16 men’s and women’s basketball programs showed the women had 3.2 times the amount of social media followers.
Women’s volleyball had a 365% commercial NIL increase in 2024-25. Meanwhile, Opendorse said 82.0% of the softball audience is under 34 while only 42.9% of college baseball fans were.
“As 83.9% of collegiate rev-share dollars are expected to go to football and men’s basketball, investing in commercial NIL with women’s sports is not only equitable but it’s good business,” Opendorse wrote.

