


The temptation when compiling the tale of the tape in a rivalry game is to examine and analyze recent matchups.
So what the heck do we do with the 2020 Territorial Cup? The term “anomaly” doesn’t do it justice. It was a fiasco. Maybe even a farce.
But there are lessons that can be learned from the most recent meeting between Arizona and Arizona State. That will be the starting point for the final 2021 edition of “Cats Stats,” in which we look at five sets of numbers that could determine the outcome of Saturday’s game at Sun Devil Stadium:
1. Turnover margin
This was a bit of a problem for the Wildcats last year. They probably would have lost anyway, but a torrent of turnovers made it impossible and turned the game into an epic rout.
Arizona gave the ball away an astounding seven times. The last time the Wildcats had more than four turnovers in a game was Sept. 22, 2016, against Utah (five).
We’d like to say things have gotten a lot better. Alas, Arizona is still last in the nation with a turnover margin of minus-15.
The Wildcats have improved, marginally, in terms of protecting the ball. They have five turnovers in their past four games, or 1.25 per contest. They had 16 in the previous seven games (2.29).
In terms of taking the ball away, Arizona has stalled. The Wildcats have forced only six turnovers, third fewest in the nation entering this week. They’ve had only one takeaway in the past six games.
ASU has 18 takeaways, third most in the Pac-12. But the Sun Devils also have 19 giveaways, which is tied for second most.
A minus-1 turnover margin is highly unusual for the Sun Devils under Herm Edwards. They ranked first or second in the Pac-12 in that category in each of his first three seasons.
ASU experienced the perils of poor ball security on Oct. 30 vs. Washington State. The Sun Devils turned it over on each of their first three possessions and five times in all. The Cougars took a 28-0 lead and won 34-21 in Tempe.
2. Kickoff-return average/touchbacks
If they can avoid surrendering a touchdown on the opening kickoff, that will represent progress for the Wildcats.
Last year’s debacle began when D.J. Taylor took the opening kick 100 yards for a TD. It was a shocking development given Lucas Havrisik’s propensity for touchbacks.
The Sun Devils were ready for him, though, positioning their return men several yards deep in the end zone. Had any UA coach bothered to alert him, Havrisik could have kicked the ball shorter and/or lower and avoided that outcome.
Havrisik has been money again this season with 41 touchbacks in 49 kickoffs — an 83.7% rate. But it takes only one slipup by the kicker/coverage team to alter the course of a game. Opponents have returned only four kickoffs vs. Arizona, but they average 37.3 yards when they do.
This wasn’t that, but Havrisik’s first kickoff at Washington State last week caromed out of bounds (or so the officials said). The Cougars got the ball at the 35-yard line and ended up with a plus-10 differential in average starting field position.
Taylor is still ASU’s primary return specialist. He doesn’t have a touchdown this season, but he did return a kickoff 60 yards vs. WSU. He also ranks second in the Pac-12 with a 13.8-yard average on punt returns.

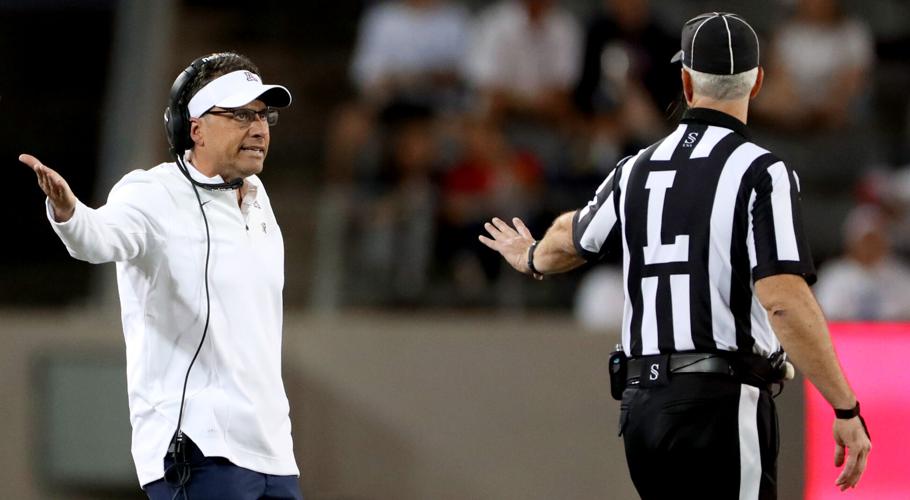
The Wildcats have committed 21 more penalties than their opponents this season, a mounting source of frustration for coach Jedd Fisch.
3. Penalty differential
This can be measured in two ways.
One is by the number of infractions. Arizona has had fewer fouls than the opposition only one time this season. That was the Utah game, which Jedd Fisch this week described as “probably our best game all year.” The Wildcats didn’t win, but they went toe-to-toe with the Utes for four quarters — the same Utes who blasted No. 3 Oregon the following Saturday.
Arizona has had the same number of penalties as the opposition three times, most recently against Cal (the Wildcats’ lone victory of the season). The Wildcats are minus-21 for the season, and it’s been a source of ongoing frustration for Fisch and his staff.
Arizona was flagged 11 times at WSU, the fourth time this season the Wildcats have been hit with 10 or more penalties in a game. Most were against the offense, putting the Wildcats behind the chains for most of the night. When you’re 11th in the Pac-12 in average yards per play (4.86), that’s a recipe for failure.
Remarkably, Arizona and its opponents have been assessed exactly 749 yards apiece in penalties. That speaks to the ticky-tacky nature of many of the Wildcats’ infractions.
Only 14 schools had more penalty yardage assessed against them entering this week. ASU was one of them.
The Sun Devils had the third-most penalty yards against (874). Only three teams had more infractions than ASU’s 98. (Arizona has 93.)
The Sun Devils have been flagged 10-plus times in four games this season. Three times (Southern Utah, BYU, Utah), they’ve had 13 or more penalties totaling more than 100 yards. They lost two of those three.

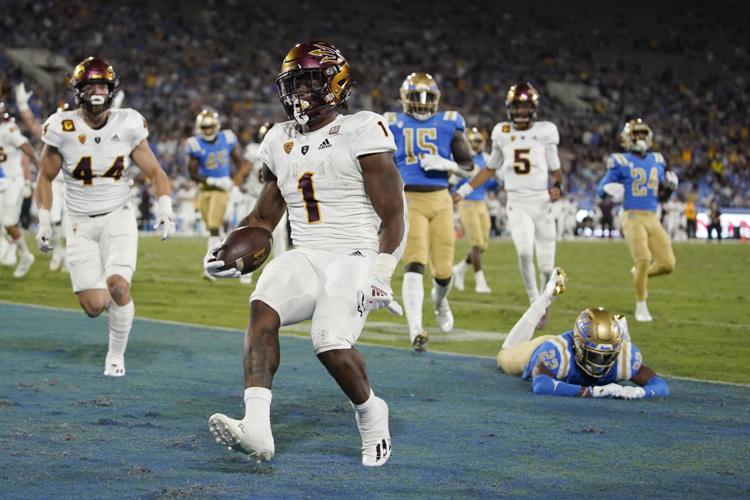
Arizona State running back DeaMonte Trayanum, center, runs in for a touchdown during the Sun Devils' win over UCLA earlier this season.
4. Red-zone TD percentage
The bane of Fisch’s existence and a season-long problem.
Arizona has only 11 touchdowns in 34 trips inside the red zone. The Wildcats’ TD rate of 32.3% ranks last in the nation.
Again, Arizona has made progress in this area — but not nearly enough. The Wildcats are 6 of 14 (42.9%) in their past five games after going 5 of 20 (25.0%) in their first seven. The former still would rank last in the Pac-12 by a wide margin.
ASU ranks sixth in the league at 65.2%. The Sun Devils have more red-zone touchdowns (30) than the Wildcats have overall scores (25).
Arizona isn’t particularly effective at preventing red-zone touchdowns either. The Wildcats rank last in the Pac-12 and 124th nationally, allowing TDs at a 74.3% clip (26 of 35). ASU ranks in the middle of the pack at 62.2% (23 of 37).
The biggest challenge for Arizona’s defense will be stopping ASU’s rushing attack — especially in the red zone. Of the Sun Devils’ 30 red-zone touchdowns, 24 have come on the ground.
5. QB pressures
This might apply to every quarterback ever, but both Arizona’s Will Plummer and ASU’s Jayden Daniels suffer a huge drop-off in production when they’re pressured.
According to Pro Football Focus, here’s how those numbers break down this season:
PLUMMER
Clean pocket: 107 of 169 (63.3%), 937 yards, 5.5 YPA, 4 TD, 4 INT
Under pressure: 21 of 60 (35%), 326 yards, 5.4 YPA, 1 TD, 4 INT
DANIELS
Clean pocket: 152 of 218 (69.7%), 1,844 yards, 8.5 YPA, 8 TD, 6 INT
Under pressure: 24 of 49 (49%), 285 yards, 5.8 YPA, 0 TD, 3 INT
The numbers are pretty striking. Combined, Plummer and Daniels have a 41.3% completion rate and a 1-7 touchdown-to-interception ratio when pressured.
So the question then becomes: Which defense has a better chance to put pressure on the opposing QB?
Plummer has faced pressure on 34.7% of his dropbacks, per PFF. Daniels has faced pressure 26.8% of the time.
PFF doesn’t provide the same data for defenses. But there is a way, albeit less precisely, to compare the pressure the UA and ASU defenses have been able to create.
Arizona has generated 130 pressures, per PFF. UA opponents have 269 pass attempts and have been sacked 21 times for a total of 290 dropbacks. That comes out to a 44.8% pressure rate for the Wildcats. ASU’s rate is 40.6%.
Two things to note about those calculations: (1) The dropback total is an approximation because it doesn’t factor in scrambles; and (2) the number of pressures isn’t exact because more than one player can be credited with a pressure on a given play.
Again, though, we’re using the same criteria for both sides. So it’s at least a valid comparison.
When you combine the pressure rates — allowed and generated — ASU has a slight edge.
Photos: Every U of A vs. ASU football game since 1975
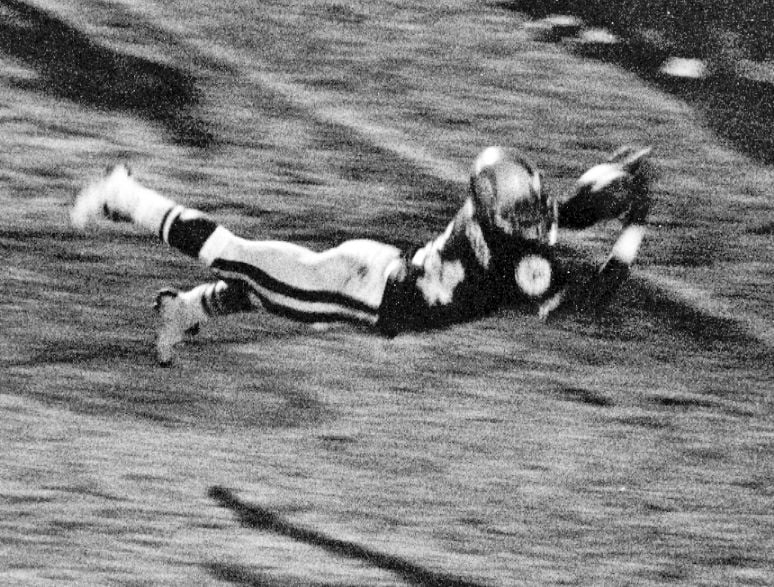
1975: ASU 24, UA 21 – "The Catch" by Arizona State University receiver John Jefferson during the 1975 ASU/UA football game. Courtesy ASU

1976: ASU 27, UA 10 – This ASU receiver missed the catch, but ASU won the game against UA on Nov. 27, 1976. Arizona Daily Star
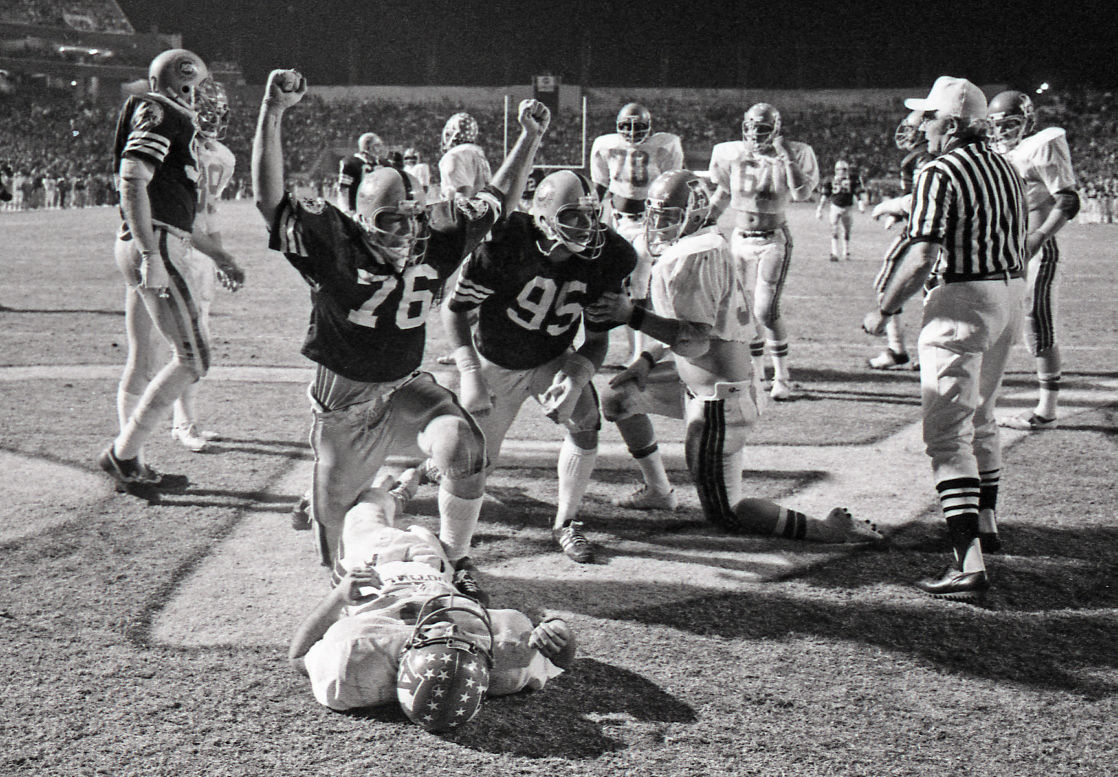
1977: ASU 23, UA 7 – Arizona State’s Bob Pfister raises his arms over a downed University of Arizona quarterback Marc Lunsford after ASU forced a 2-point safety on Nov. 26, 1977 in Tempe, Ariz. ASU won, 23-7. P.K. Weis / Tucson Citizen

1978: ASU 18, UA 17 – Arizona State quarterback Mark Malone is sacked by an University of Arizona defender in Arizona Stadium on Nov. 25, 1978. H. Darr. Beiser / Tucson Citizen

1979: UA 27, ASU 24 – Arizona Wildcats players celebrate after edging Arizona State, 27-24, in Tempe on Nov. 24, 1979. H. Darr Beiser / Tucson Citizen
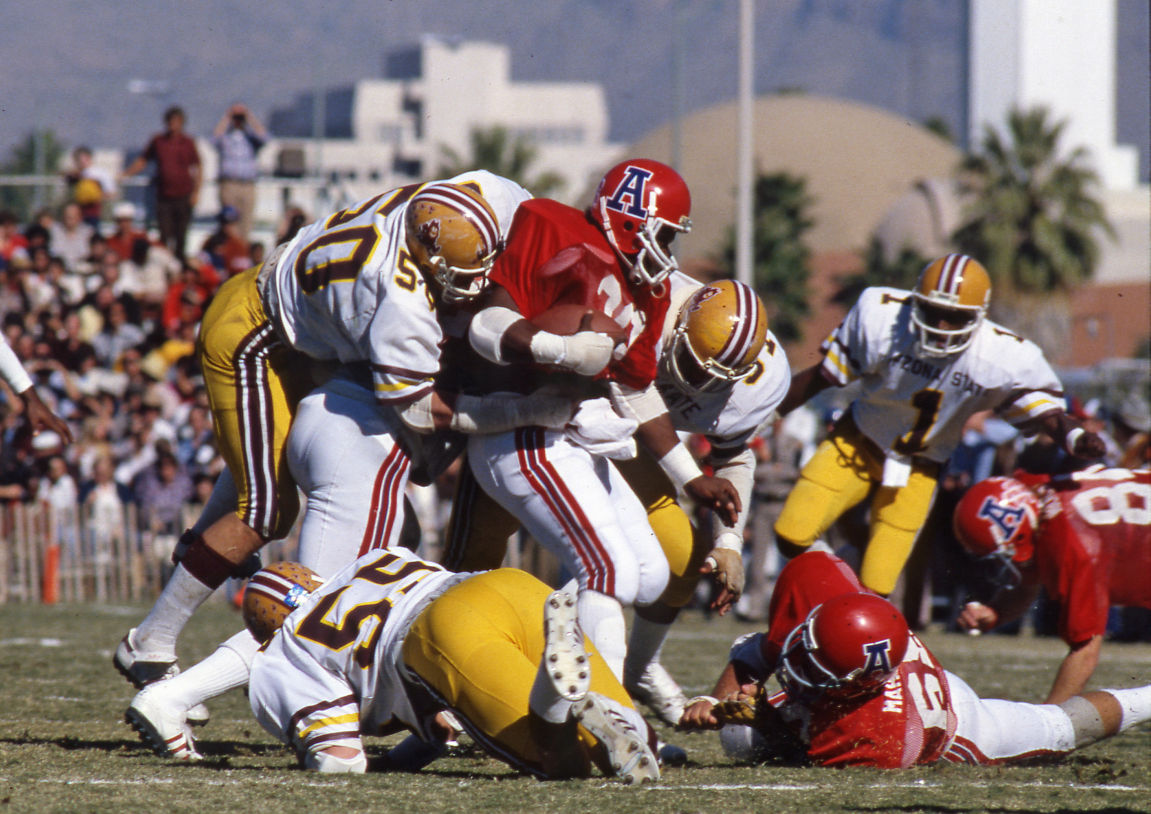
1980: ASU 44, UA 7 – UA fullback Courtney Griffin is wrapped up by the ASU defense on Nov. 29, 1980 in Tucson, when the north end zone was still wide open. P.K. Weis / Tucson Citizen

1981: ASU 24, UA 13 – The celebration was short-lived for the Wildcats, since the Sun Devils pulled off a victory on at wet, muddy day on Nov. 28, 1981. Peter Weinberger / Tucson Citizen

1982: UA 28, ASU 18 – University of Arizona quarterback Tom Tunnicliffe looks to pass during the 1982 ASU/UA football game. Tucson Citizen
1983: UA 17, ASU 15 – The Arizona offense stretches for yardage against ASU on Nov. 26, 1983 in Tempe. Glenn Capers / Tucson Citizen

1984: UA 16, ASU 10 – The goal posts came down at Arizona Stadium on Nov. 24, 1984, as Arizona edged ASU. David Schreiber / Tucson Citizen

1985: UA 16, ASU 13 – Max Zendejas of UA leaps into the air after booting the game-winning field goal against ASU on Nov. 23, 1985 in Tempe. Warren Faidley / Tucson Citizen

1986: UA 34, ASU 17 – UA's Chuck Cecil #6 races out of the ASU end zone enroute to a 106-yard interception for a touchdown in the fourth quarter on Nov. 22, 1986. Photo by Bruce McClelland / Arizona Daily Star

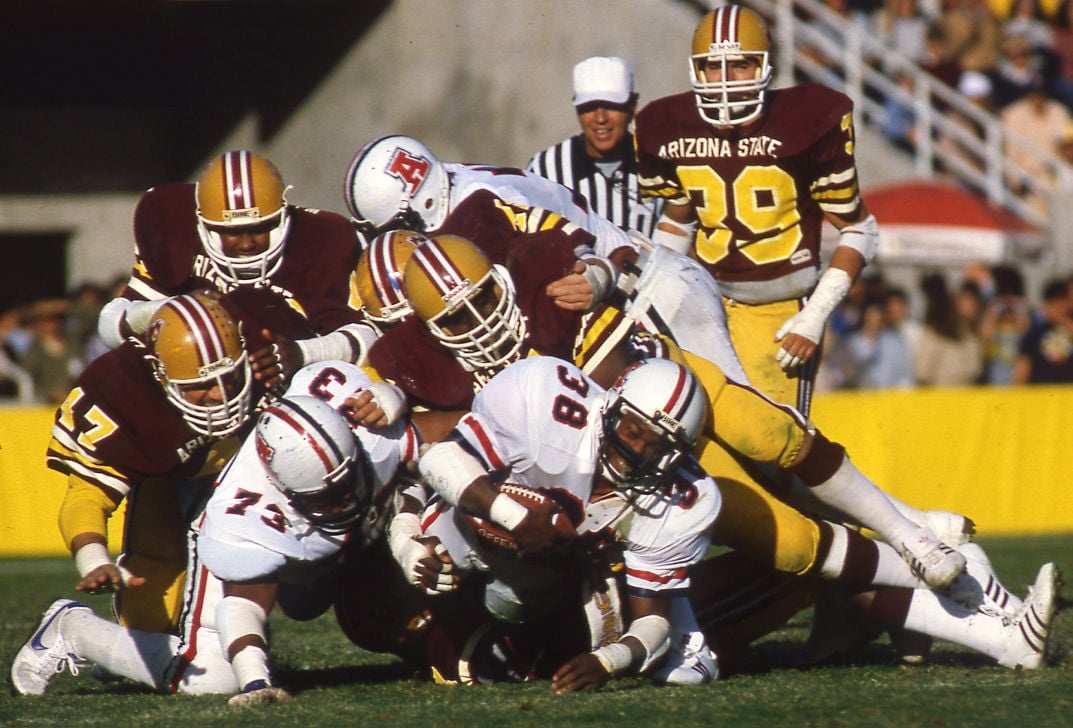
1987: ASU 24, UA 24 – An Arizona running back gets wrapped up by ASU defenders on Nov. 28, 1987. Warren Faidley / Tucson Citizen
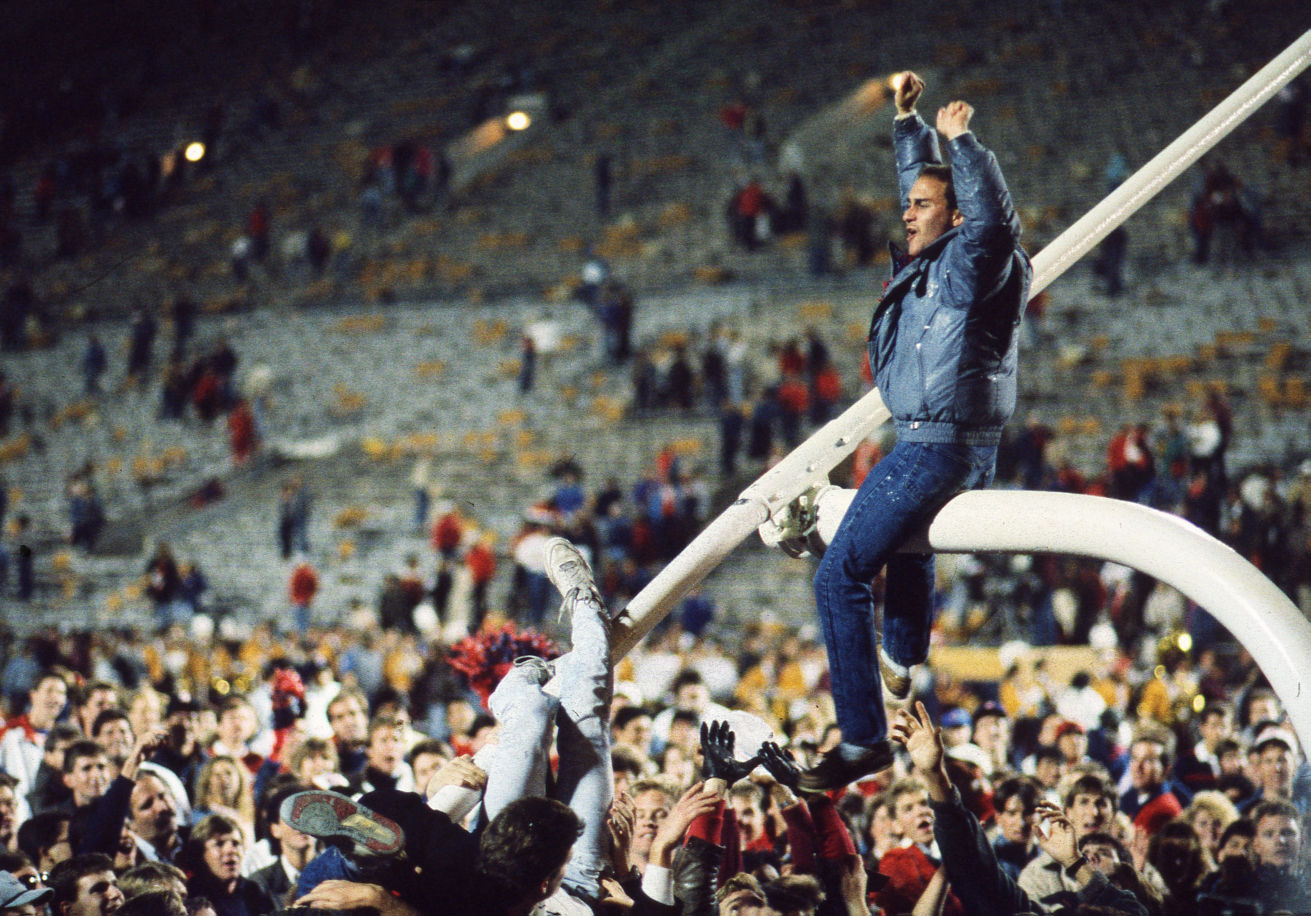
1988: UA 28, ASU 18 – Fans toppled the goal posts after UA beat ASU in Tucson on Nov. 26, 1988. Rick Wiley / Tucson Citizen

1989: UA 28, ASU 10 – UA’s Reggie Johnson forces ASU quarterback Paul Justin to fumble, which set up a UA score on Nov. 25, 1989 in Tempe. Rick Wiley / Tucson Citizen

1990: UA 21, ASU 17 – ASU’s Adam Brass dips his head after UA scored on a bad snap on Nov. 24, 1990 in Tucson. Rick Wiley / Tucson Citizen
1991: ASU 37, UA 14 – ASU’s Michael Williams defiantly downs UA running back Ontiwaun Carter on Nov. 23, 1991. Rick Wiley / Tucson Citizen

1993: UA 34, ASU 20 – ASU quarterback Jake Plummer on the turf after he was downed by UA’s defense, including Tedy Bruschi, on Nov. 26, 1993 in Tempe. Rick Wiley / Tucson Citizen
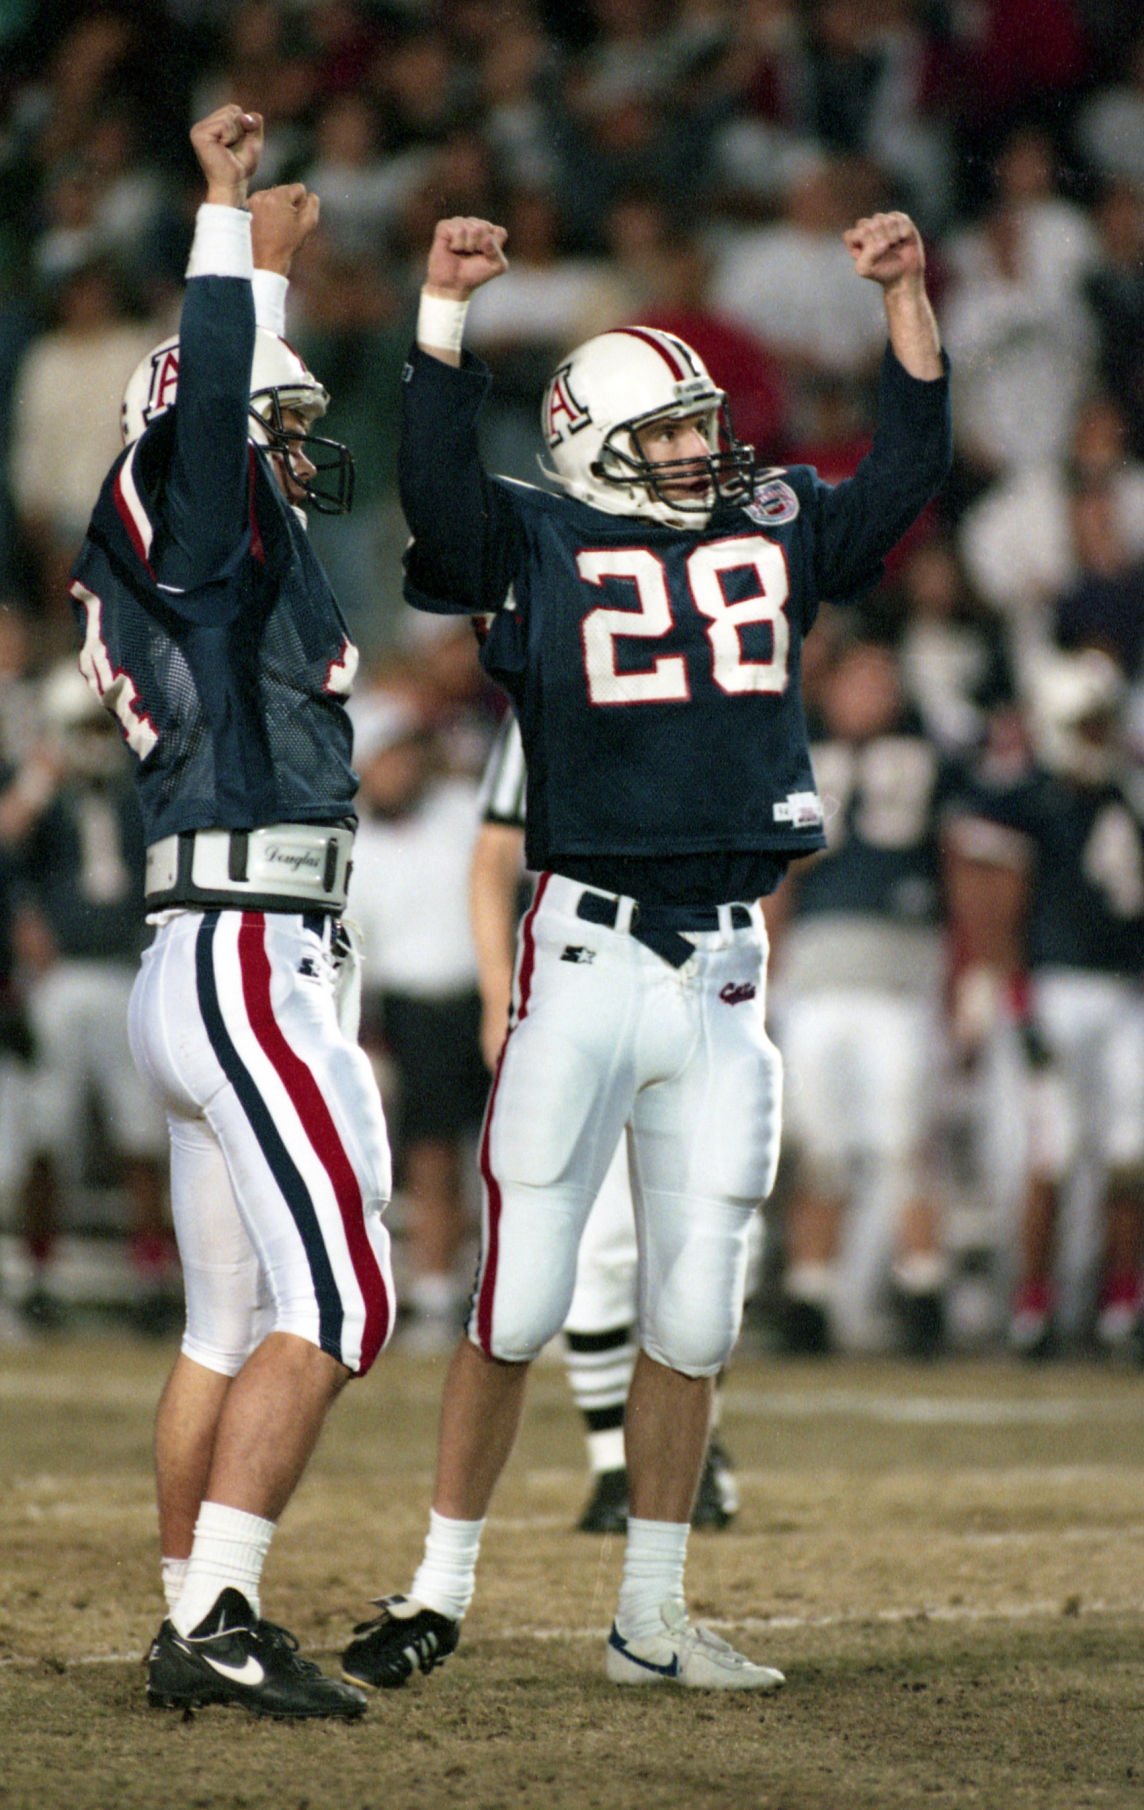
1994: UA 28, ASU 27 – UA kicker Steve McLaughlin, right, and holder Ryan Hesson watch the ball go through the uprights during the Arizona State vs. Arizona football game on Nov. 25, 1994. Photo by Rick Wiley / Tucson Citizen

1995: UA 31, ASU 28 – ASU head coach Bruce Snyder greets UA head coach Dick Tomey after the game during the 1995 Arizona vs. Arizona State football game on Nov. 24, 1995. Photo by Bruce McClelland / Arizona Daily Star

1996: ASU 56, UA 14 – ASU's Jake Plummer got his revenge, powering the Sun Devils to victory on Nov. 23, 1996 and a trip to the Rose Bowl. Brian Winter / Arizona Daily Star

1997: UA 28, ASU 16 – UA Tight End Mike Lucky #88, catches a pass in front of ASU's Damien Richardson #39 on Nov. 28, 1997. Jeffry Scott / Arizona Daily Star

1998: UA 50, ASU 42 – ASU QB Ryan Kealy #8 is sacked by UA's Mike Robertson #55 on Nov. 27, 1998. UA went on to finish the season with a 11-1 record, the best the school has ever had. Benjie Sanders / Arizona Daily Star

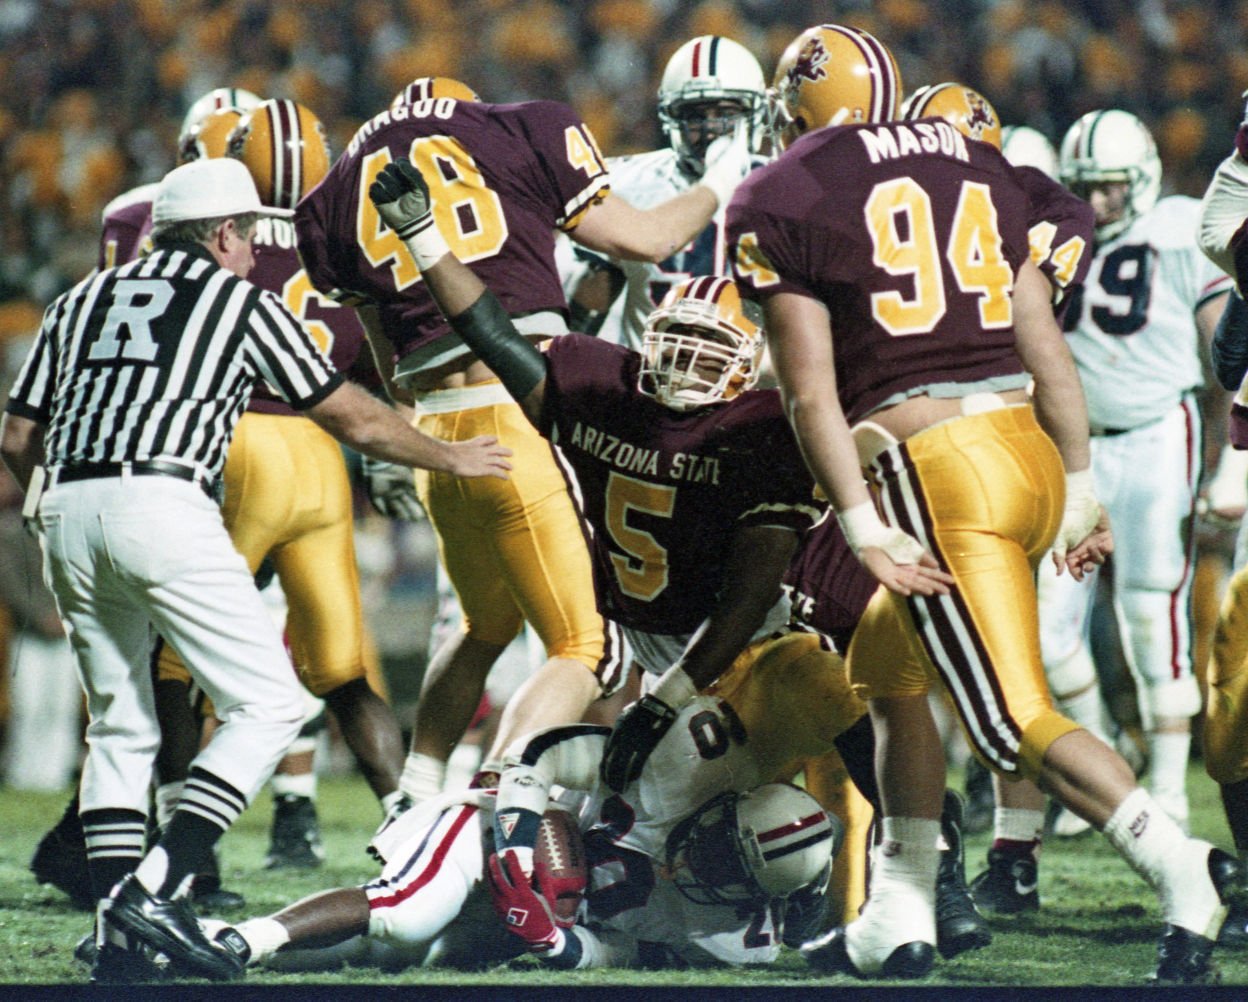
1999: ASU 42, UA 27 – UA's Dennis Northcutt is trying to get away from ASU defender Adam Archuleta #40, who dragged down Northcutt for a loss on Nov. 27, 1999. Benjie Sanders / Arizona Daily Star

2000: ASU 30, UA 17 – UA football coach Dick Tomey walks off the field at Arizona Stadium after congratulating ASU coach Bruce Snyder on Nov. 24, 2000. Tomey resigned after the game.
2001: UA 34, ASU 21 – Arizona's Bobby Wade, a Phoenix native, scores the first touchdown of the game on Nov. 24, 2001. His 11 catches and 157 yards were career bests for the junior. David Sanders / Arizona Daily Star

2002: ASU 34, UA 20 – ASU tailback Mike Williams dives into the end zone for one of his three second-half touchdowns Nov. 29, 2002 against Arizona. Aaron J. Latham / Arizona Daily Star

2003: ASU 28, UA 7 – Arizona State's Chris McKenzie, left, holds on to Arizona wide receiver Ricky Williams after Williams caught a pass from Kris Heavner on Nov. 28, 2003, in Tempe. (AP Photo/Roy Dabner)

2004: UA 34, ASU 27 – Arizona's Steve Fleming (87) out runs Arizona State's Chad Green (21) for a second quarter touch down. Xavier Gallegos / Tucson Citizen

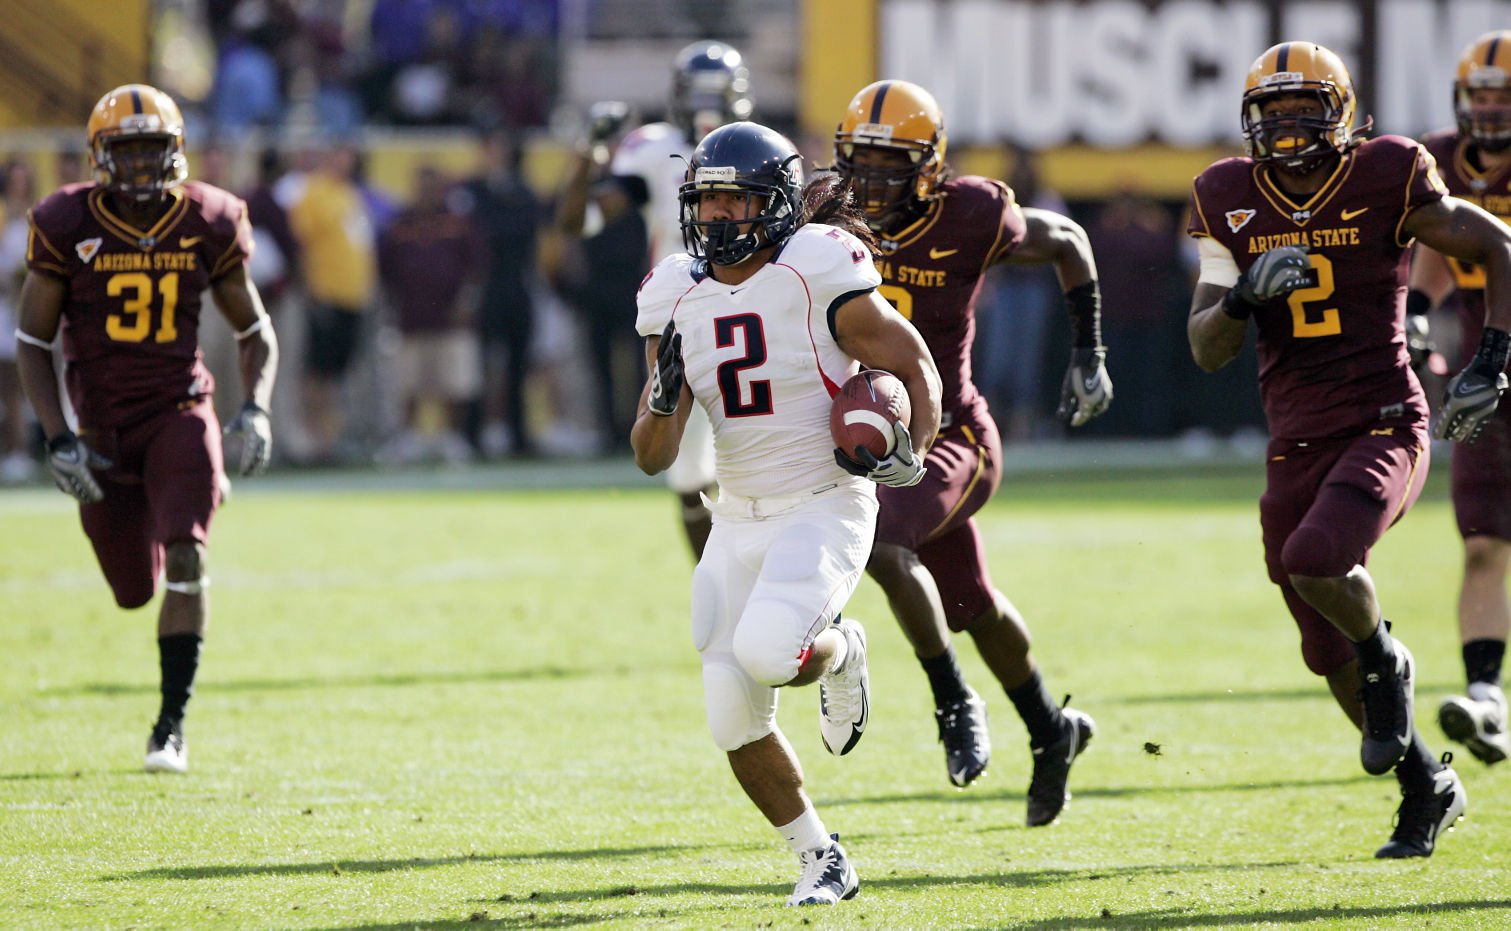
2005: ASU 23, UA 20 – Off and running: ASU's Terry Richardson sprints down the sidelines on the way to a 71-yard punt return for a touchdown against Arizona on Nov. 26, 2005, that tied the game at 20. David Sanders / Arizona Daily Star

2006: ASU 28, UA 7 – Arizona State wide receiver Chris McGaha (13) and Jamaal Lewis celebrate McGaha's touchdown at Arizona Stadium on Nov. 25, 2006. Greg Bryan / Arizona Daily Star
2007: ASU 20, UA 17 – ASU Receiver Michael Jones hauls in a TD pass in front of UA's Wilrey Fontenot in the fourth quarter in Tempe on Dec. 1, 2007. David Sanders / Arizona Daily Star

2008: UA 31, ASU 10 – Arizona's quarterback Willie Tuitama is carried off the field by the crowd after engineering a 31-10 win against ASU at in Tucson on Dec. 6, 2008. Kelly Presnell / Arizona Daily Star
2009: UA 20, ASU 17 – University of Arizona running back Keola Antolin breaks downfield for Arizona's first score against ASU on Nov. 28, 2009 in Tempe. Dean Knuth / Arizona Daily Star
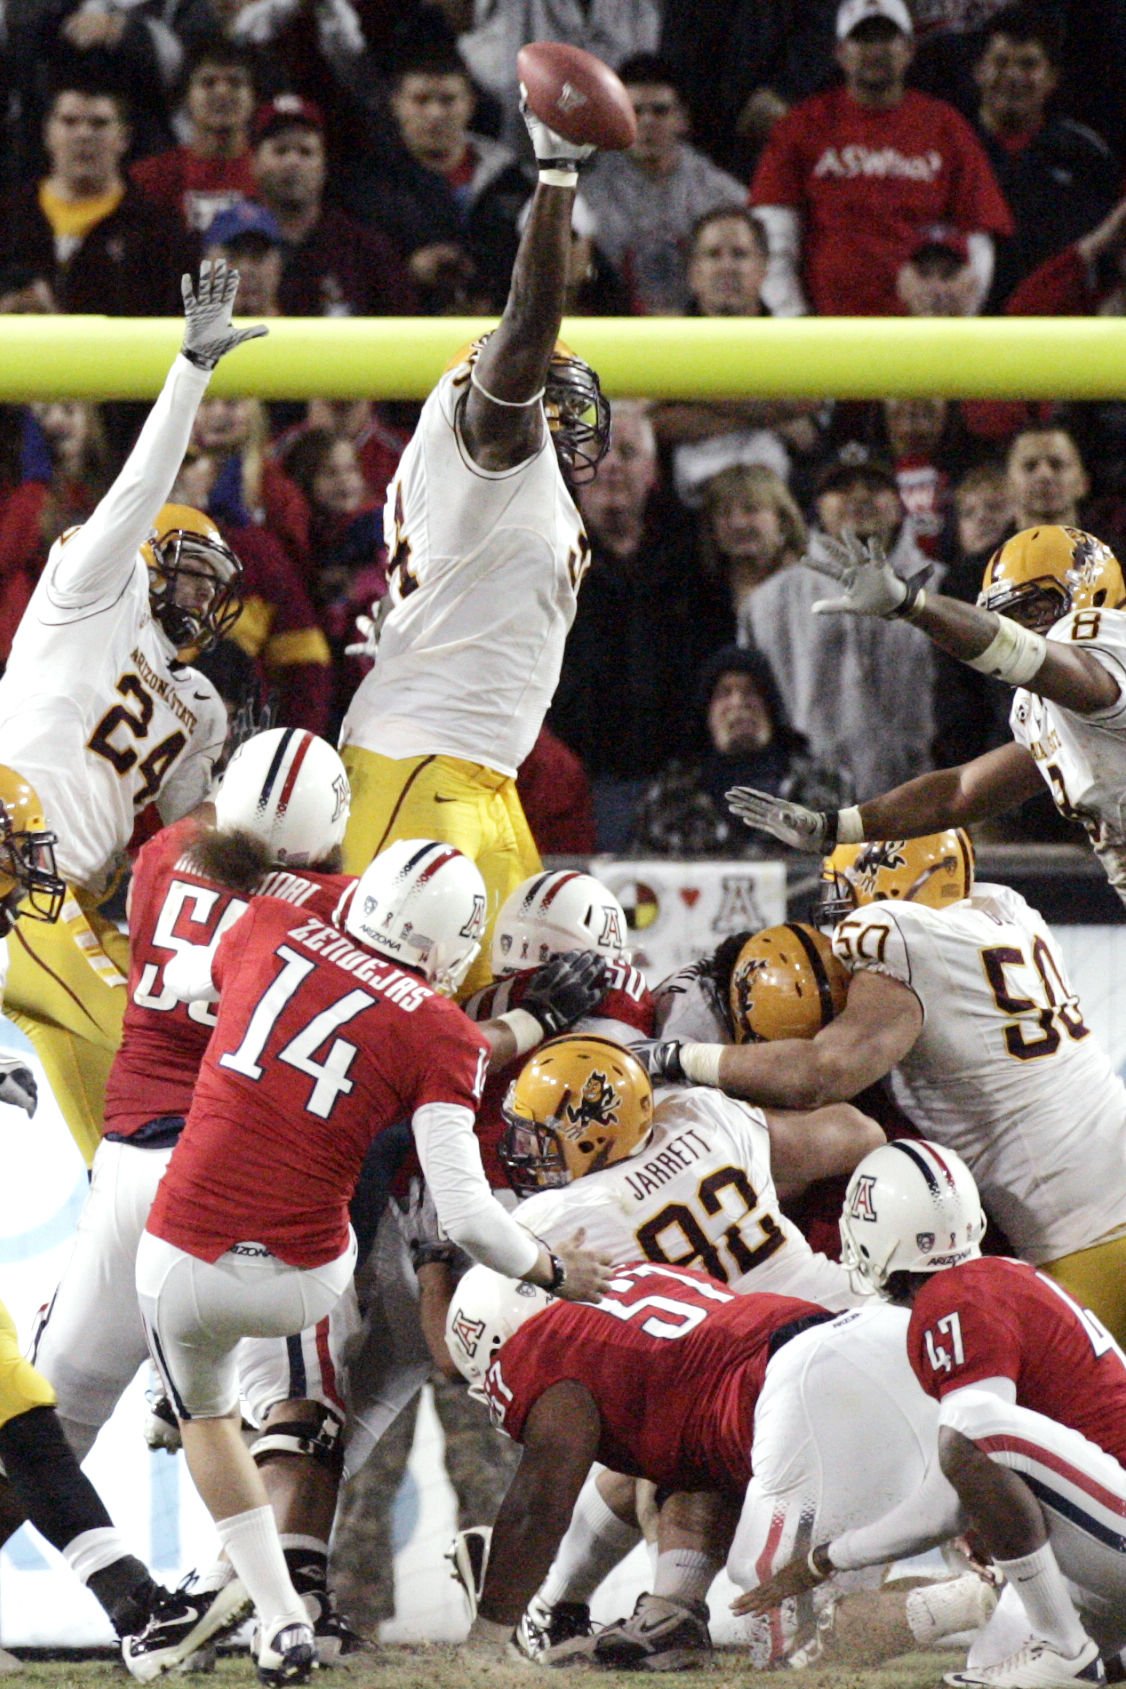
2010: ASU 30, UA 29 2OT – With the scored tied 20-20, University of Arizona's Alex Zendejas has his game winning extra point blocked by ASU's James Brooks at Arizona Stadium on December 2, 2010. Arizona lost in double overtime 30-29. Dean Knuth / Arizona Daily Star

2011: UA 31, ASU 27 – After Mike Stoops was fired, interim coach Tim Kish and quarterback Nick Foles carried Arizona through the end of the season, culminating in a victory over ASU in Tempe on Nov. 19, 2011. David Sanders / Arizona Daily Star

2012: ASU 41, UA 34 – Arizona State's Marion Grice leaps over a teammate on Nov. 23, 2012, at Arizona Stadium.

2013: ASU 58, UA 21 – Arizona head coach Rich Rodriguez looks on none too pleased during the fourth quarter on Nov. 30, 2013 in Tempe.

2014: UA 42, ASU 35 – Arizona wide receiver Samajie Grant strides into the end zone on a 69-yard touchdown pass on Nov. 28, 2014

2015: ASU 52, UA 37 – Arizona State Sun Devil running back Demario Richard (4) runs into a swarm of Arizona Wildcats defenders during the fourth quarter of the Territorial Cup at Sun Devil Stadium on Nov. 21.

2016: UA 56, ASU 35 – Arizona Wildcats cornerback DaVonte' Neal (19) celebrates his interception during the first quarter of the Arizona State University Sun Devils vs. University of Arizona Wildcats in the Territorial Cup college football game on Nov. 25 at Arizona Stadium. The Wildcats redeemed a dismal season, beating the Sun Devils, 56-35.

2017: ASU 42, Arizona 30 — Arizona State Sun Devils players celebrate with the Territorial Cup after the University of Arizona Wildcats vs. Arizona State University Sun Devils in the Territorial Cup college football game on Nov. 25.

2018: ASU 41, Arizona 40 — Arizona State Sun Devils offensive lineman Steven Miller (71) rams the pitchfork into the Arizona Wildcats end zone after the Territorial Cup on Nov. 24 at Arizona Stadium in Tucson. Arizona State rallied in the fourth quarter for the win.

2019: ASU 24, UA 14 – Arizona Wildcats wide receiver Jamarye Joiner (10) jukes Arizona State defensive back Evan Fields (4) as he moves the ball up field for a touchdown during the Territorial Cup at Sun Devil Stadium in Tempe on Nov. 30.

Arizona’s bench watches the second quarter unfold in the Wildcats’ 70-7 loss against Arizona State at Arizona Stadium on Dec. 11, 2020. Head coach Kevin Sumlin was fired afterward.

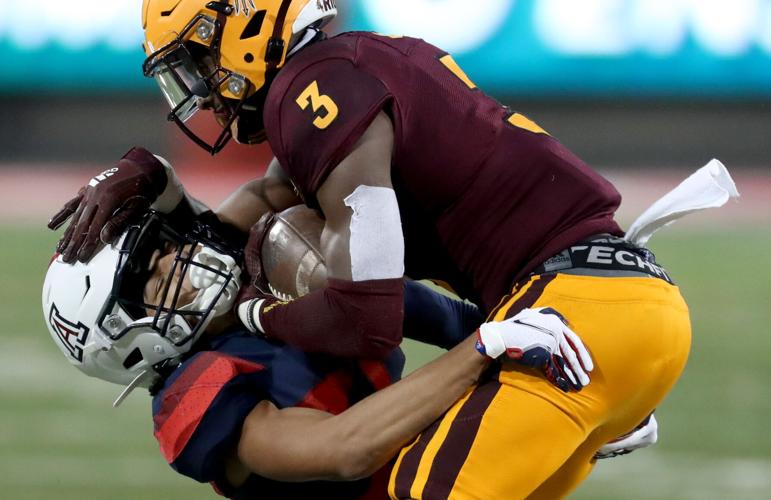
2021: ASU 38, UA 15: Arizona Wildcats safety Jaxen Turner brings down Arizona State wide receiver Ricky Pearsall after a midair catch in the third quarter at Sun Devil Stadium. The loss ended a disappointing first season for new head coach Jedd Fisch at 1-11. But the slow rebuilding process was showing fruit, with better morale and a Homecoming win over Cal.

