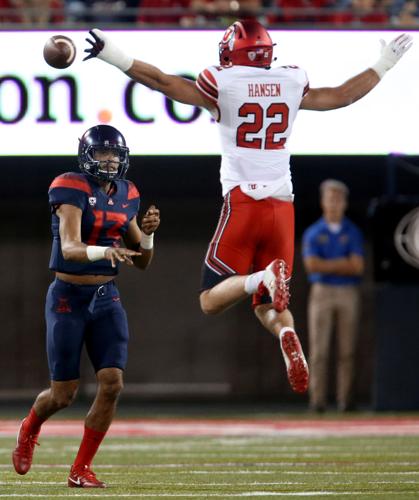
Arizona finally ended its six-year bowl drought this season. It’s been even longer since the Wildcats defeated Utah.
The Cats’ last victory over the Utes came in November 2015. Since then, the Utes have won six in a row in the series. (The teams’ scheduled game in 2020 was canceled.) And most of them haven’t been close.

Only one (30-24 in 2017) was a one-score game. Only one other (38-29 in 2021) had a margin of less than 10 points. Overall, Utah has scored exactly twice as many points as Arizona — 226-113 — over those six games.
In other words, domination.
With No. 22 Utah coming to town Saturday for No. 17 Arizona’s home finale, this week’s “Cats Stats” will explore five sets of numbers behind the Utes’ winning streak — which followed the Wildcats winning the previous four matchups — and why the result might be different this time.

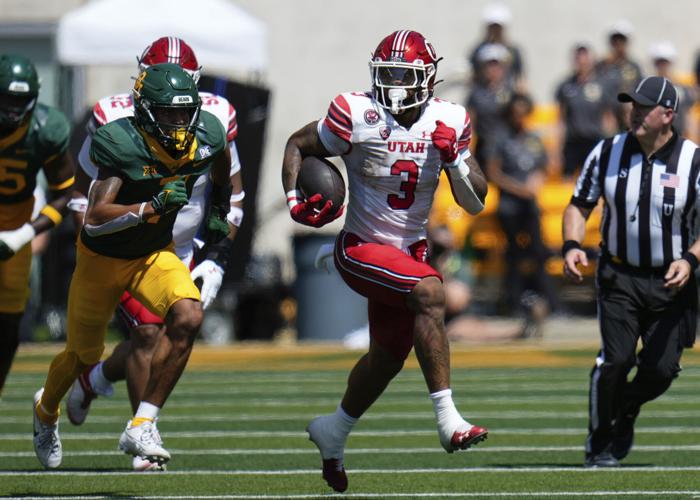
Utah running back Ja'Quinden Jackson, shown breaking off a big run vs. Baylor earlier this season, had 97 of the Utes' 306 rushing yards against Arizona in their 2022 matchup.
RUN GAME
2016-22: When it comes to the rush — running the ball and stopping the run — Utah generally crushes it. That’s been a theme in most of the past six games between the Utes and Wildcats.
Utah outrushed Arizona in five of those six contests, usually by a wide margin. The Utes surpassed 200 yards three times and eclipsed 300 last year. They’ve averaged 221.5 yards per game on the ground vs. the Wildcats — while limiting Arizona to 119.7.
The only time Arizona outrushed Utah was 2017. The Wildcats also outgained the Utes overall in that contest. We’ll get to what happened in that game in a bit.
2023: In terms of stopping the run, Utah is still Utah. The Utes rank second in the Pac-12 in yards allowed per game (85.6) and per rush (3.14).
Arizona, meanwhile, has improved dramatically against the run. The Wildcats are yielding just 99.4 yards per game and 3.22 yards per rush — down from 209.1 and 5.59 last season. Arizona has held four opponents under 80 yards and three others under 115.
Utah isn’t running the ball quite as well as a year ago. The Utes are averaging 184.9 yards on the ground (fifth in the conference), down from 217.6 (second). Arizona has experienced a slight uptick, going from 144 yards per game to 157.7, due mostly to game flow — i.e., close games and/or having the lead. Their average per rush is basically the same — 4.88 this year vs. 4.91 last year.
Utah — which averages the most rushing attempts per game (42.1) in the Pac-12 — is down by over a yard in per-carry average, going from 5.44 last year to 4.39 this year.
THIRD DOWN
2016-22: In each of the past four meetings, Utah has converted third downs at a higher rate than Arizona. The difference was significant in 2019 (54.5%-16.7%) and 2022 (66.7%-27.3%). Not surprisingly, those games were both blowouts, with final scores of 35-7 and 45-20.
Third-down conversion rate usually correlates with time of possession, and Utah had a huge edge in that area as well in the ’19 and ’22 matchups. The Utes had an advantage of 19:04 in 2019 and 15:58 last year.
Arizona won the third-down battle in 2016 and ’17 but lost the war. The reason will become clear soon.
2023: First, the good news — Arizona has improved on third down on both sides of the ball. The Wildcats are converting third downs at a 46.4% rate, which is third in the Pac-12 and up from 41.18% last year (seventh). They’re limiting opponents to a 39.69% clip, which is sixth in the league and down from 47.76% last season (10th).
Without QB Cam Rising, among others, Utah isn’t nearly as efficient on third downs this year. The Utes’ conversion rate of 39.46% ranks ninth in the conference and is significantly lower than last year’s 50.56% (fourth).
The Utes’ third-down defense is better than ever. In fact, it’s the best in the country.
Utah is limiting opponents to a 25.58% conversion rate. The Utes lead the Pac-12 in that category for the second year in a row. They were at 31.52% in 2022.
Correspondingly, Utah has allowed the fewest first downs in the Pac-12 (14.7 per game) and leads the league in time of possession (33:23) this season.

Former Arizona QB Brandon Dawkins threw five interceptions in two games against Utah in 2016 and ‘17, leading to a pair of defeats for the Wildcats. In all, Arizona has lost six straight in the series to the two-time defending Pac-12 champion Utes.
TURNOVER MARGIN
2016-22: This one is interesting to say the least. In three of the past four games against Utah, Arizona has not committed a turnover. We double- and triple-checked this, and it’s true!
The Wildcats lost four fumbles in last year’s game in Salt Lake City — two apiece charged to Jayden de Laura and Jacob Cowing. Arizona had one takeaway in each of the 2018 and ’19 games — both interceptions thrown by Tyler Huntley.
The Wildcats lost all four of those games, as you know. The bounces of the ball played a minor role in last year’s rout. In the previous three meetings, the Utes were just better, period.
The 2016 and ’17 games, with Rich Rodriguez on the UA sideline, were different. Arizona outgained Utah in both contests and had better third-down percentages. However, the Wildcats were minus-3 in turnover margin in both games, largely because of five Brandon Dawkins interceptions. That’s a surefire way to lose.
2023: If there’s one area where you can knock the Wildcats this season, it’s here. They have only eight takeaways (third fewest in the Pac-12) and a minus-4 turnover margin (fourth worst in the league).
Utah is tied for the fifth-most takeaways (14) in the Pac-12. And, despite frequent offense struggles, the Utes have given the ball away only eight times (tied for third fewest). Their turnover margin of plus-6 is exactly the same as last year’s.
RED ZONE
2016-22: Two numbers jump out here. The first is that Utah had a significantly higher touchdown rate (69.7%) in the red zone than Arizona (43.8%). The other is that the Utes had many more cracks at it — 33 vs. 16.
The Wildcats actually had a higher red-zone TD percentage in the 2016, ’17 and ’19 games. But they only got there a combined six times compared to 16 for Utah. Last year, the Cats went 2 for 3 while the Utes went 6 for 8.
2023: Improving in the red zone on both sides of the ball has been a priority under Jedd Fisch, and Arizona has succeeded in that regard.
The Wildcats have achieved respectable results after being one of the worst teams in the country in the “red area” at the outset of Fisch’s tenure. They’re currently 30th nationally in red-zone TD rate on offense (68.18%) and tied for 44th on defense (55%).
Utah has been just about as stingy on defense, yielding a TD rate of 56%. The Utes have struggled to punch the ball into the end zone, posting a TD rate of 54.05%. That’s tied for 92nd nationally. They were 11th in that category in 2022 (72.6%) and ninth the year before (71.23%).
Advantage, Arizona?
FIELD POSITION
2016-22: If you’ve followed Utah football at all, you won’t be surprised to learn the Utes have controlled this area of the game. It’s part of their DNA under Kyle Whittingham.
Utah had the edge in average starting field position in five of the six games, including three with a difference of 14 or more yards. Last year, fueled by the aforementioned fumbles, it was plus-21. The Utes started three drives in UA territory and another at midfield.
The only time Arizona had the advantage was 2017 — by a mere yard.

Utah's Jack Bouwmeester is the best punter in the Pac-12, a large reason the Utes rank in the top 25 nationally in average net starting field position.
2023: Utah ranks 24th nationally in average net starting field position at plus-4.1 yards, according to BCFToys.com. Arizona ranks 111th at minus-4.1 yards.
Utah has the best punter in the Pac-12 in Jack Bouwmeester, who not only leads the league in gross average (45.6) among qualifiers but has dropped the most punts inside the 20-yard line (20).
Arizona had a 16-yard deficit in average starting field position last week at Colorado and started three drives inside its 10-yard line.
Whittingham would love nothing more than to punt and field position the Wildcats to death, Iowa-style.
Arizona head coach Jedd Fisch held a news conference on Monday as the Wildcats prepare for Utah following four straight wins. Video by Justin Spears / Arizona Daily Star


